Changes in Meteorology
A lot has changed in the forecasting world since WeatherQuest’s inception, with massive advancements in technology, understanding of processes and number/availability of observations. In this article we will be going through just a few of these developments made within meteorology.
Forecasting
Numerical Weather Prediction Models
Numerical Weather Prediction (NWP) involves dividing the earth into a 3D grid and using supercomputers to ingest observations before running intricate mathematical models based on the dynamics and physics of the atmosphere. There are two main types of forecast model, Global and Regional. Global models produce a forecast for conditions over the whole earth at a relatively low resolution and are very useful for seeing large scale patterns and how they will develop. Regional models focus on smaller areas at a much higher resolution, enabling a much clearer localised forecast for users. WeatherQuest use both types of models, and depending on the location of our customer, our forecasters will look at multiple models to give the most accurate forecast they can.
Back in the late 90s and early 00s global models were limited to a spatial resolution of between ~60-90 km, with regional models reaching ~12-15 km. With advancements and improvements to all aspects of the process over the years, the current Met Office equivalent models now run at ~10 km and 1.5 km respectively, providing much greater spatial accuracy in forecasts. Models have since also been “coupled” with the earth system, integrating the physical interactions between the atmosphere, ocean, cryosphere and land surface and how they influence meteorological phenomena downstream, further increasing their accuracy. One example of this are convection-permitting models, which can be used to simulate the development of convective thunderstorms at incredibly fine spatial and temporal resolutions, aiding in rainfall/flood and lightning forecasting.
(Met Office, History of numerical weather prediction, 2026)
Ensemble Forecasting
Despite being first developed in the 1970s, ensemble forecasting has seen massive improvements over the last 25 years. An ensemble forecast works by combining multiple NWP models with slightly differing starting conditions, leading to a model spread of various likely weather outcomes. Where these outcomes more closely agree, there is higher confidence in the forecast for those specific conditions occurring. As computer power has increased, so has the ability to include more models and at higher resolutions into these ensembles. The European Centre for Medium-Range Weather Forecasting (ECMWF) is a world leading producer of ensemble forecasts, and back in the early nineties, their ensembles had 33 models and a resolution of 210 km. With many upgrades since then, the numbers now stand at 51 models with a resolution of 9 km, gaining a skilful forecast lead time of around 1.5 days every decade; the current 9-day ensemble forecast is as useful as the 5-day forecast was back in 1998. WeatherQuest use these ensembles for our forecasts beyond seven days, providing both the extremes and the most likely values for each day. We also use them for our monthly and subseasonal forecasts, stretching out to 28 days ahead.
(ECMWF, 2022)
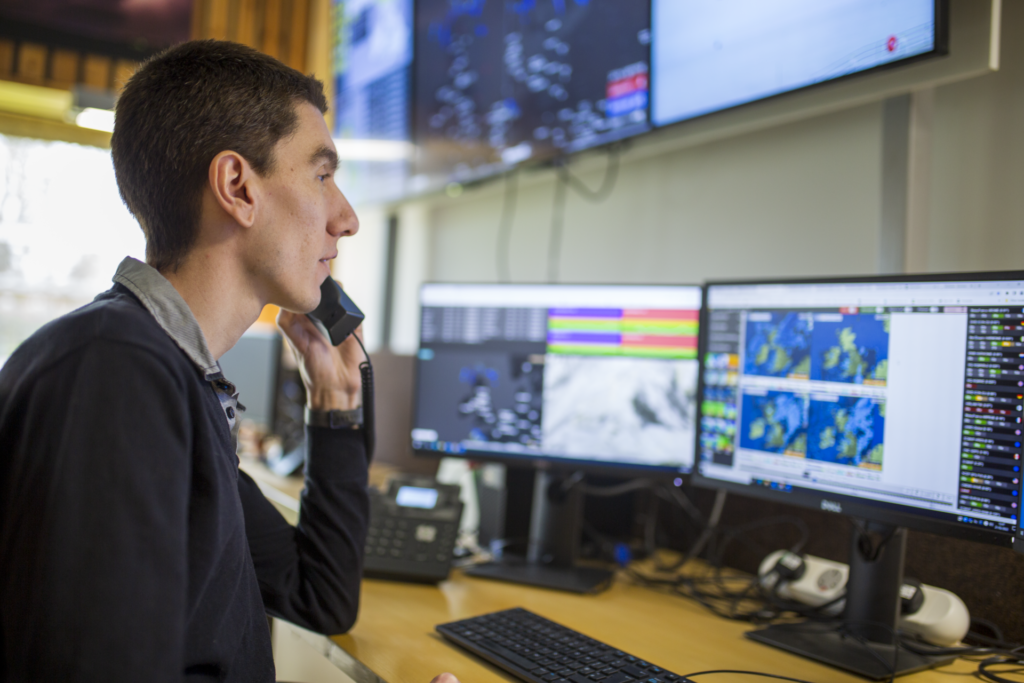
Observations
Observations are one of the most important aspects of weather forecasting, with many different kinds used within the industry. Two vital applications of observations include providing current conditions for models to use in forecast runs and allowing forecast verification by comparing past forecasts to the observed conditions. WeatherQuest use observations daily to intervene on warnings, verify and edit our forecasts and produce climatologies for a wide range of customers. So, what’s changed?
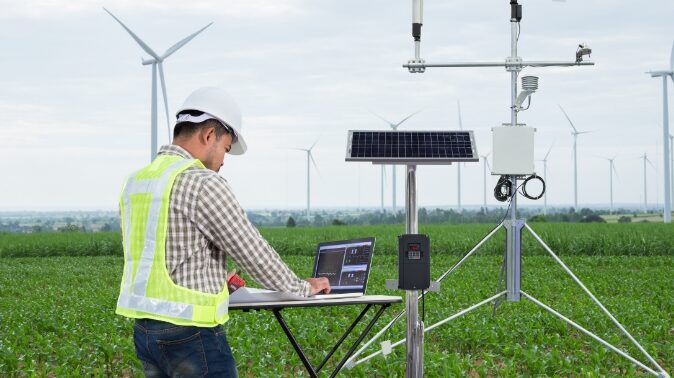
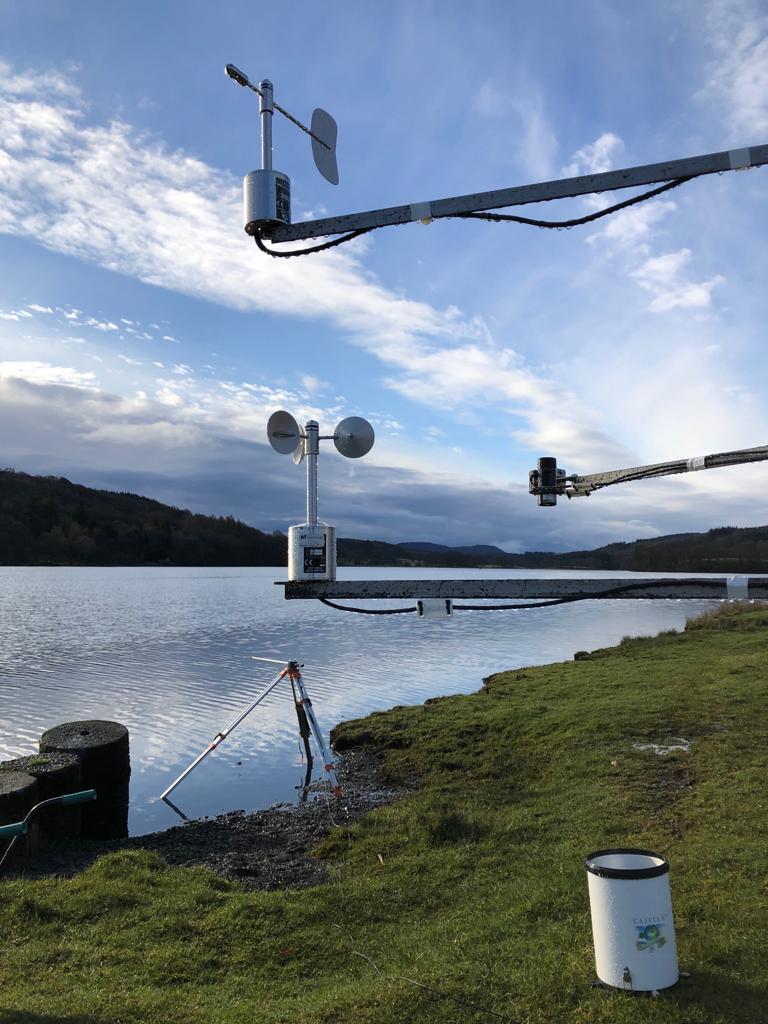
Stations
Many weather stations in the 90s were still relying on the manual logging of observations, where on-site staff would record the current conditions and enter them manually into a database. Since then, automated weather stations have become the norm, allowing for greater measurement frequency and reliability. Combining this with the fact that instruments and logging systems have undergone constant improvements, precision and accuracy has also increased. This has greatly helped in climatological studies and use of past weather data, ensuring a consistent and timely stream of weather conditions.
(Met Office, The UK land observation network, 2026)
Satellites
Since the 2000s there has also been a major increase in high resolution satellite observations, with the sector still making rapid and large developments today. They come in the form of Geostationary (a persistent picture of the same point above earth), and polar orbiting (providing swathes of images at much higher resolution) satellites, and can measure an ever-increasing array of variables. This helps cover some ground where land-based observations cannot be made. For example, large areas of Africa have seen little to no introduction of land-based stations, with some areas actually having a decline in station density. One of the simplest but most powerful tools is visible light satellite imagery (basically a near-live photo of the earth from space). This allows meteorologists to compare cloud patterns to real-time observations including rainfall, temperature and wind and increase confidence in their forecasts.
(Smith & Ward, 2025)
Radar
Radar was first introduced back in WW2 with the aim of detecting the location of enemy aircraft by pulsing out electro-magnetic waves and listening for an echo. After the war, the technology turned to focus on a more meteorological application of detecting precipitation. Initially the technology could only determine the location of the precipitation, but by the 1970s, doppler radars were installed across the UK. Doppler radars send out two short pulsed horizontally polarised electromagnetic waves, which bounce off any form of precipitation and return to the receiver. It then subtracts the second pulse from the first to determine not only the location, but also the intensity/rate of the precipitation.
Since the 00s, a new technology for radar has emerged, dual polarisation. Working in a similar way to doppler radars, dual polarisation radars also send out a vertical pulse. By using computer technology to combine both the horizontal and vertical, it forms a cross-section that can be used to determine precipitation type, and size. This also allows for better differentiation between precipitation and non-precipitation phenomena, and therefore the accuracy of the radar overall. WeatherQuest utilise radar data in our own WQRadar web application and in rainfall tracking sections on our client portals.
(Met Office, National Meteorological Library and Archive, 2023)
(NOAA National Severe Storms Laboratory, 2026)
Public Observations
Weather stations have also become cheaper and more readily available, not just for companies and businesses, but also for the public. With many more people owning different weather sensors, public observations can therefore contribute to broader networks and help detect patterns in more localised weather. Despite this, it is incredibly difficult to verify public sensors, and so public networks can include unreliable observations. Public observations don’t have to involve sensors either, as with some simple instructions, reports can be made into many different citizen science projects. In fact, WeatherQuest uses public observations in our snow depth report map, to help the public see which areas in the UK have the deepest snow: https://weatherquest.co.uk/snowdepth/map.
Argo programme
One of the largest increases in global observations was the deployment of Argo floats, an array of temperature, salinity and current profiling buoys dotted around the world’s seas and oceans. Beginning in 1999, 3000 floats were deployed by November 2007, with the current number being around 4000 floats. Although the floats don’t measure surface air temperature, sea surface temperatures (SSTs) play one of the largest roles in generating and affecting our weather through ocean-atmosphere interactions. In fact, large-scale systems such as the El Niño Southern Oscillation (ENSO) are primarily driven by SSTs, and ENSO is known for affecting global temperatures and large-scale regional rainfall patterns. SSTs are also the driving force behind hurricanes/typhoons/tropical cyclones and more localised low pressure storms. With this SST data, forecasting at both mesoscale (1-1000 km) and synoptic scale (>1000 km) has become much more reliable and accurate.
(Argo Programme, 2026)
New Advances
There are many current large-scale developments occurring in the world of meteorology. Most notably (as with a lot of other sectors) is the integration of Artificial Intelligence (AI) and Machine Learning (ML) technologies. Although traditional models are physics-based, newer AI/ML models are trained on vast arrays of past data to determine patterns and relationships and use them in their forecasts. This means that AI/ML forecasts can be run faster and on significantly lower powered machinery with GPUs, instead of the large-scale supercomputer CPUs. This can allow meteorological agencies in developing countries to generate useful and accurate forecasts for their populace. In fact, it’s not just limited to countries and meteorological agencies, as some large companies including Google, Huawei and Nvidia have begun to produce deep learning models that produce forecasts. Many current AI/ML forecasts are beginning to become competitive in the short- to medium-range forecast period, whilst others provide long-term/climate based projections.
Where AI really shines in the world of meteorology is its use in nowcasting. To produce a nowcast, current high frequency observations/datasets (such as those from radar and satellites) and short-range forecasts are combined by models to produce a forecast for the conditions of the next 0-6 hours in a very high spatial resolution. This is extremely helpful for those working in disaster prevention and aid, generating far more accurate flood warnings or tornado path projection for example. Nowcasting could also be used by those whose operations are tied to conditions with exact cut-off thresholds, who want to operate as much as possible on very marginal days.
Although AI/ML forecasts are making huge advancements, our changing climate is a limitation. Models need to be trained on historical observations and as our weather becomes more extreme, into conditions not previously seen, AI/ML forecasts may not forecast these extreme conditions accurately, something traditional NWP models may be able to do. This is a great argument for why AI/ML forecasts are a great supplement to standard NWP models, and why both should continue to be developed as we head into the future.
(Jean, et al., 2025)

Conclusion
The field of meteorology is constantly evolving, and new insights, models, processes and datasets are always being studied and developed. With each new progression, more studies and applications appear, and before long a groundbreaking technique becomes the new norm. So much has changed over the last 25 years, it is impossible to say where meteorology will be after the next 25, but wherever the sector is headed, WeatherQuest is eager to be there.
References
Argo Programme. (2026, May 12). Argo Program. Retrieved from NOAA AOML: https://www.aoml.noaa.gov/argo/
ECMWF. (2022, November 24). 30 years of ensemble forecasting at ECMWF. Retrieved from ECMWF Media Centre: https://www.ecmwf.int/en/about/media-centre/focus/2022/30-years-ensemble-forecasting-ecmwf
Jean, M., Pappenberger, F., Chan, P. W., Bouchet, V., Stav, N., & Honda, Y. (2025, October 13). Forecasting the Future: The Role of Artificial Intelligence in Transforming Weather Prediction and Policy. Retrieved from World Meteorological Organization: https://wmo.int/media/magazine-article/forecasting-future-role-of-artificial-intelligence-transforming-weather-prediction-and-policy
Met Office. (2023). National Meteorological Library and Archive. Retrieved from Met Office: https://www.metoffice.gov.uk/binaries/content/assets/metofficegovuk/pdf/research/library-and-archive/library/publications/factsheets/factsheet_15-weather-radar-2020_2023.pdf
Met Office. (2026, May 12). History of numerical weather prediction. Retrieved from Met Office: How weather forecasts are created: https://weather.metoffice.gov.uk/learn-about/how-forecasts-are-made/history-of-numerical-weather-prediction
Met Office. (2026, May 12). The UK land observation network. Retrieved from Met Office: https://weather.metoffice.gov.uk/guides/observations/uk-observations-network
NOAA National Severe Storms Laboratory. (2026, May 12). Research Tools: Dual Polarized Radar. Retrieved from NOAA NSSL: https://www.nssl.noaa.gov/tools/radar/dualpol/
Smith, M., & Ward, A. (2025, December 22). Sentinels in the Sky: 50 Years of GOES Satellite Observations. Retrieved from NASA: https://science.nasa.gov/science-research/earth-science/sentinels-in-the-sky-50-years-of-goes-satellite-observations/