Orographic Uplift
In our penultimate post of the weather phenomena series celebrating our 25th anniversary we will be exploring orographic uplift!
The land surface has one of the largest influences in shaping the weather we experience. Surface albedo/vegetation coverage influences surface temperatures and humidity through absorbing/reflecting the sun’s short-wave radiation and undergoing evapotranspiration respectively. The surface soil moisture content also impacts how quickly the land heats up and cools down due to water having a high heat capacity [1]. However, perhaps the most impactful drivers of our weather are the physical blockers that change wind speed and direction and provide shelter to certain areas. On the small scale, this can be as little as a tree, hedge or building – have you ever hid behind one of these to hide from a cold or strong wind? On a much grander scale, the topography of the area (how mountainous it is) impacts not only the air masses downstream on their leeward side, but also the weather on their windward side. In some cases, they cause the wind and associated weather to be diverted around them – think of bands of fog, thick cloud or rain being pushed through the valleys, or entire systems being diverted around the high-altitude area [2]. Sometimes however, the air on the windward side has no other place to go than up, and this process is known as orographic lift/uplift.
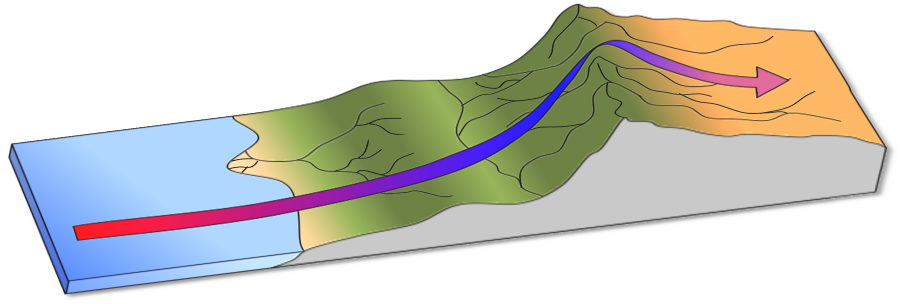
As air on the windward side of the mountain encounters the slopes, it is pushed upwards and begins to cool. This cooling continues the higher the air mass travels, at approximately 10°C per km of altitude gained, following the dry adiabatic lapse rate. After it reaches a certain height, known as the lifting condensation level, the moisture in the air begins to condense out to form clouds. The cooling then reduces to 6°C per km of altitude, due to the condensation process releasing heat back into the air [3]. If the process continues and there is unstable air aloft, the cloud continues to rise, producing little to no precipitation. If there is stable and downward moving air aloft, eventually the condensate gains a critical enough mass to either fall as rain or snow, depending on the surrounding temperature. [4]. This causes the windward side of the mountain to see incredibly high precipitation totals in the form of both rain and snow, keeping much of the area lush with vegetation [3, 5].
By the time the air reaches the peak, most of the moisture has been released, resulting in a very dry area on the leeward side of the mountain. As the air descends, it warms, becoming even drier through something known as the Foehn effect. This effect can be so strong that on the 14th -15th January 1972, the US National Weather Service saw the greatest temperature change over a 24-hour period, from -48°C to 9°C [6, 7, 8]! The resulting area downstream from the mountain is known as the rain shadow, and some of the driest places on earth are found in such areas; the Atacama Desert in Chile is the driest non-polar desert in the world and sits in the Andes rain shadow. In New Zealand, the Southern Alps sit directly in line with the mid-latitude westerlies, and as a result the western slopes receive up to 11 m of rainfall a year. On the eastern side, this drops down to less than 1 m per year [3].
The presence of a rain shadow impacts more than just the local weather. In the UK, the wet westerly winds blocked by the Scottish Highlands, the Lake District, the Pennines and the Welsh mountains create a West-East split in rainfall. This impacts the most common form of farming, with the relatively wet and mountainous West favouring pastoral agriculture, and the relatively dry East favouring arable farming. It also creates a water resource imbalance within the country, requiring infrastructure to be built that stores and transports this water cleanly and efficiently. This hydrological split is the same for many countries and continents around the world, shaping economies and relations nationally and beyond.
If you would like to do some more of your own research on Orographic uplift, use the links below to get started:
[1] University of Reading (2026). University of Reading’s Land Surface Processes Cluster. Available at: https://research.reading.ac.uk/landsurfaceprocesses/ (accessed: 19/06/2026)
[2] Ryogo Sato, Hiroyuki Kusaka (2022). Climatological study of airflow channelling in relation to surface geostrophic wind. Available at: https://rmets.onlinelibrary.wiley.com/doi/10.1002/met.2082 (accessed: 19/06/2026)
[3] ScienceInsights (2026). What is Orographic Uplift and How Does It Work? Available at: https://scienceinsights.org/what-is-orographic-uplift-and-how-does-it-work/ (accessed: 19/06/2026)
[4] WMO (2026). Orographic influence on the windward side. Available at: https://cloudatlas.wmo.int/en/orographic-influences-on-the-windward-side.html (accessed: 22/06/2026)
[5] Sam Collentine (2025). Orographic Lift, Explained. Available at: https://opensnow.com/news/post/mountain-orographics-explained (accessed: 19/06/2026)
[6] Met Office (2026). Foehn effect. Available at: https://weather.metoffice.gov.uk/learn-about/weather/types-of-weather/wind/foehn-effect (accessed: 19/06/2026)
[7] Skybrary (2026a). Föhn Effect. Available at: https://skybrary.aero/articles/fohn-effect (accessed: 22/06/2026)
[8] Sybrary (2026b). Chinook winds. Available at: https://skybrary.aero/articles/chinook-winds (accessed: 22/06/2026)