During our 25th Anniversary celebrations, we thought we should celebrate the weird and wonderful world that is the weather by going through some of our favourite weather phenomena. In this sub-series of articles, we will be going into the details of how they are produced and provide some examples.
As a nice start to the series, we will be looking at quite a few peoples’ favourite, snow!
What is it?
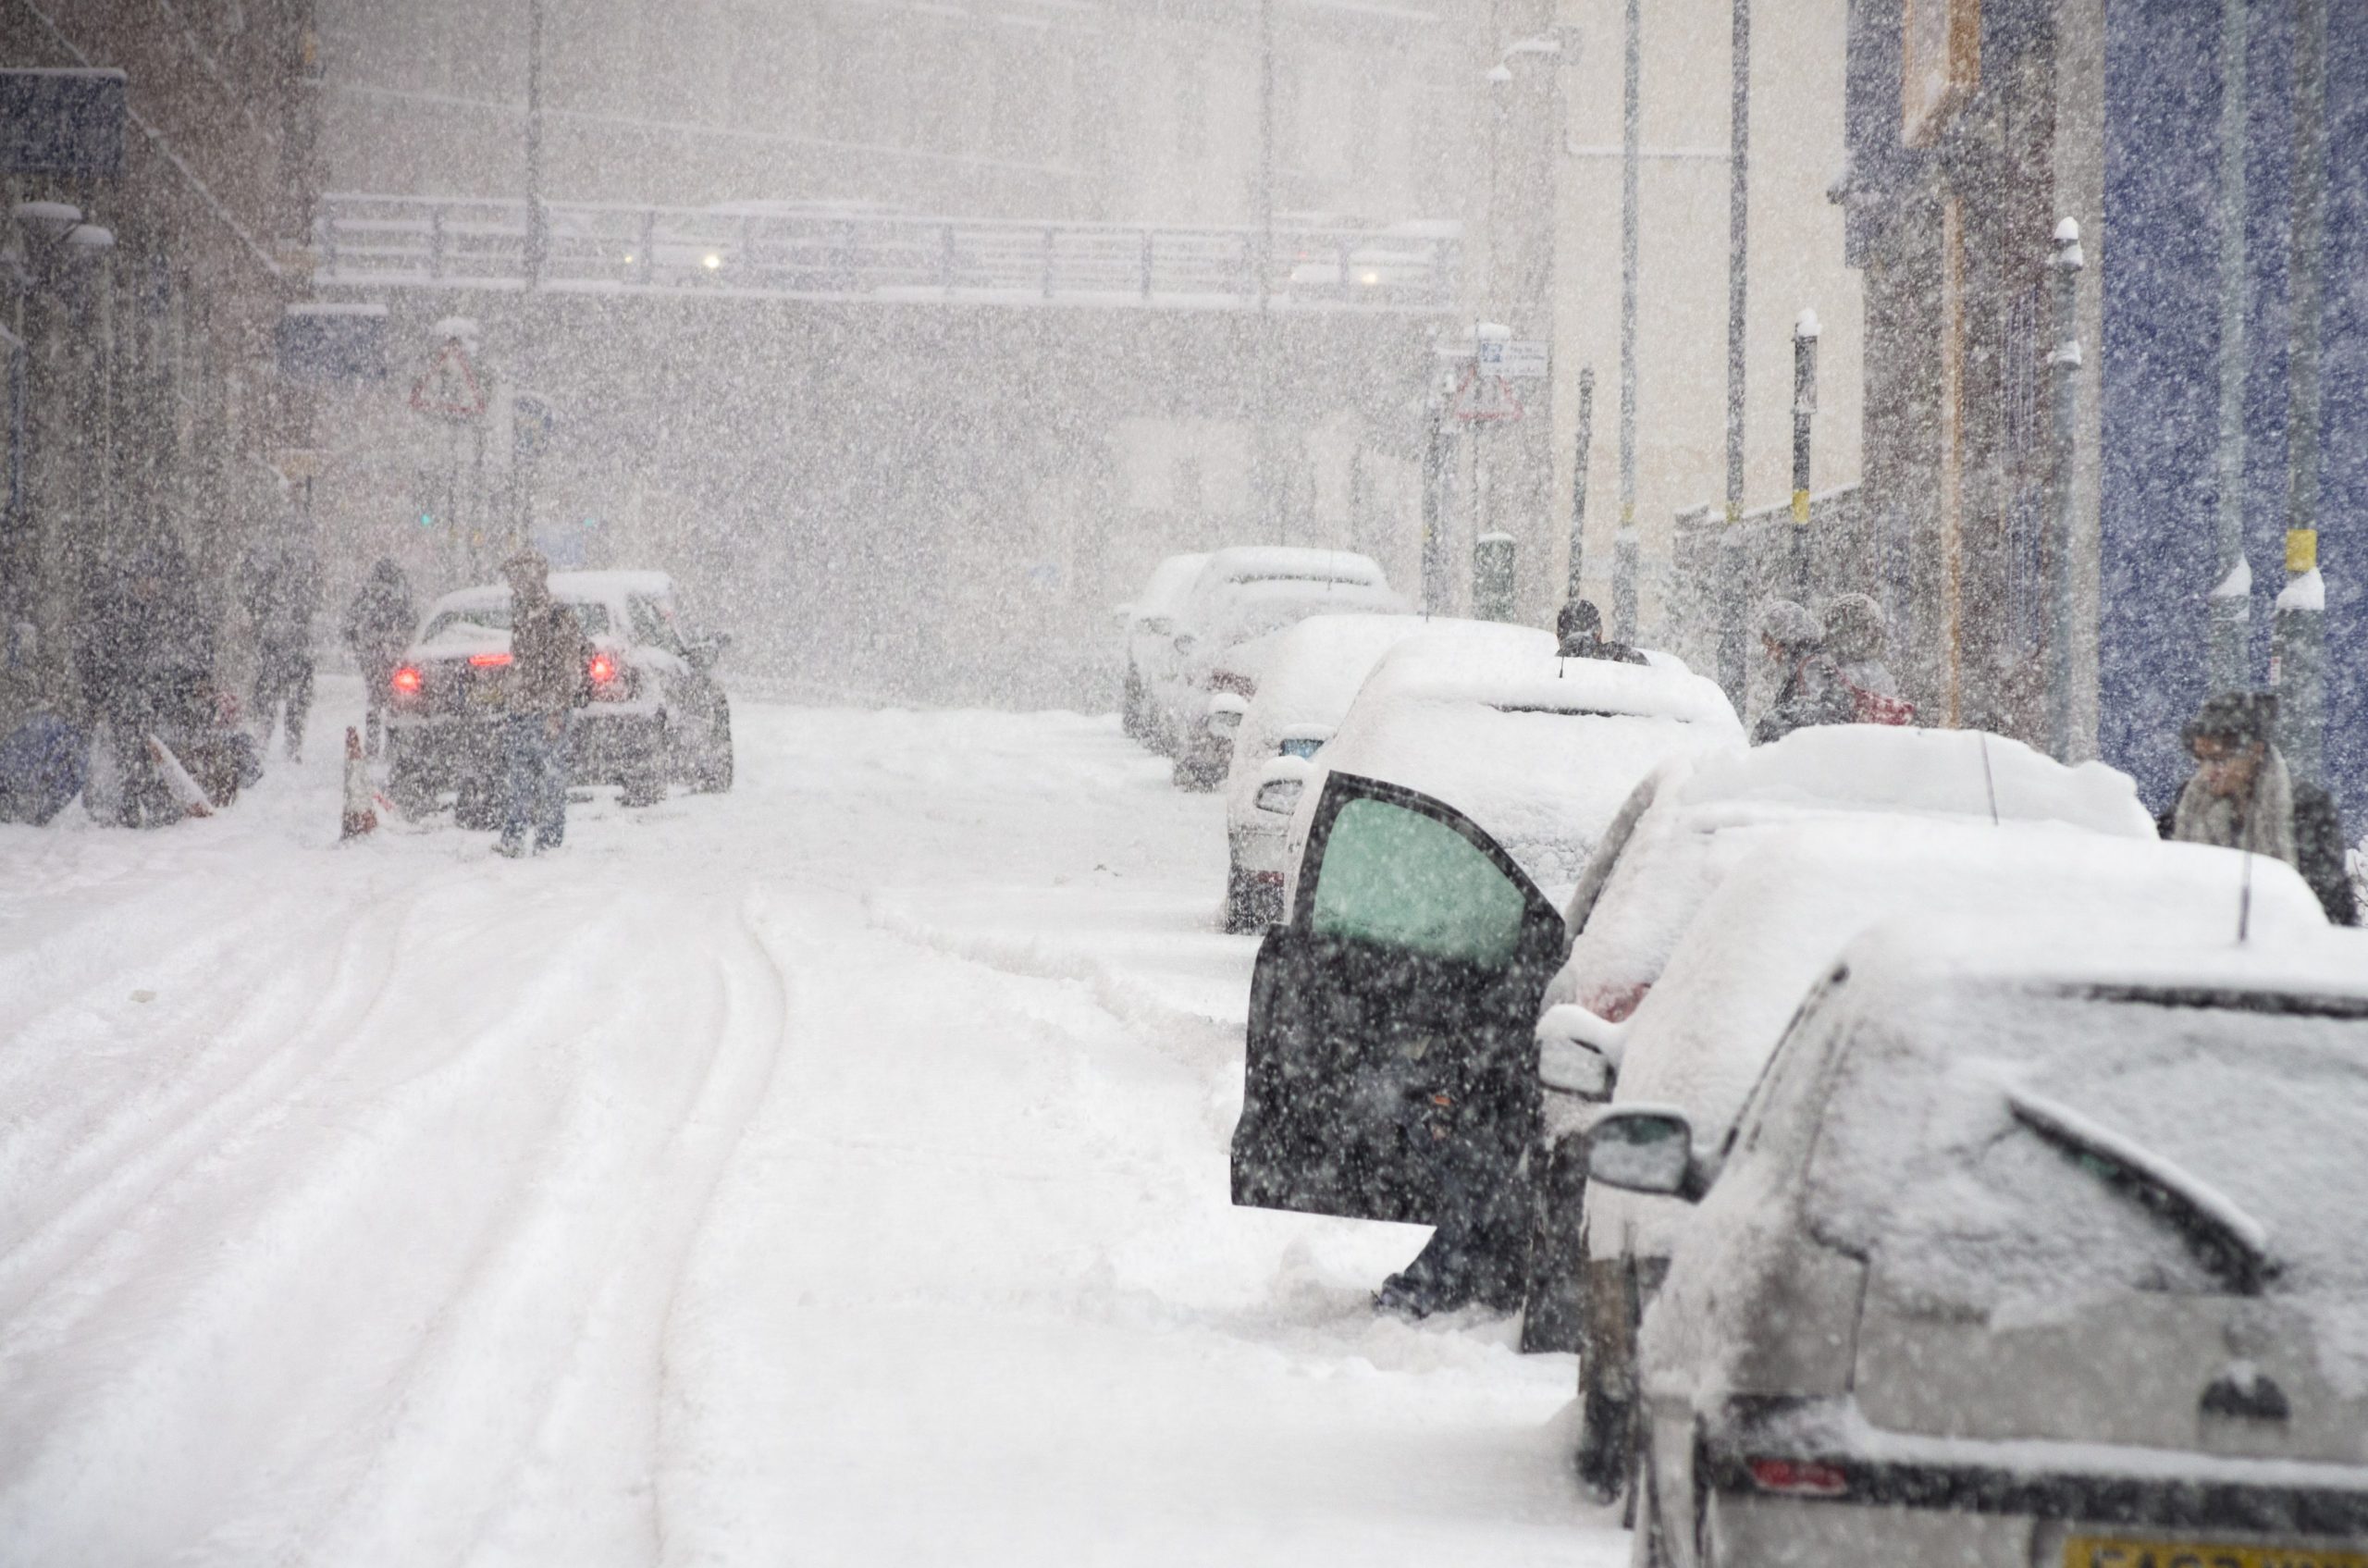
Snow is one of most transformative weather conditions we have in the UK, making the environment look completely different when it settles. Depending on where it falls, and how much, it can cause disruption for many.
Snow is the collective term for small ice crystals that stick together, and is formed when moisture in the atmosphere (usually within clouds) freezes during air temperatures of below 2 °C. Once frozen and of a critical mass, the snow begins to fall, normally between 1-4mph, depending on flake density and wind strength [1]. In meteorology we use three different terms to describe snowfall: slight, moderate and heavy – all of which are measured by the visibility during their snowfall, at >1 km, between 0.5 – 1 km, and <0.5 km respectively [2].
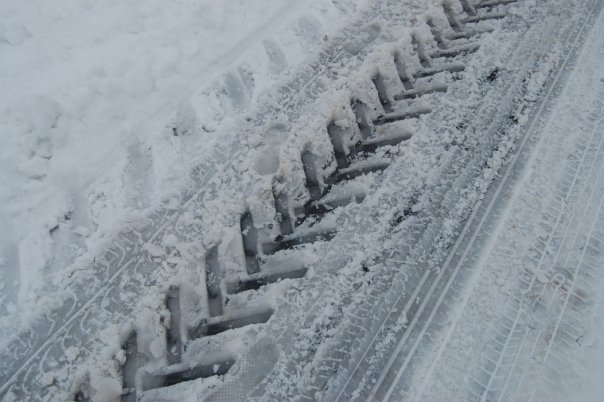
The size of the crystals/flakes is proportional to the temperature of the air in which it falls, with warmer air forming larger flakes due to them melting and sticking together more easily. These larger flakes settle and clump together more easily on the ground and are therefore much greater for creating snowmen and snowballs. This is known meteorologically as wet snow. Dry snow occurs when the air temperature is much colder and drier, forming smaller flakes. These flakes are less likely to clump together and so form a dustier snow cover that can be blown in the wind. This form of snow is favoured for winter sports such as skiing [1].
How often and how much?
The annual occurrence of snowy weather changes depending on the location within the UK. Often areas further north and of higher ground tend to see more snow throughout the year (Scottish Highlands), with the opposite occurring for the South and lower lying areas. On average however, the UK sees ~13 days of lying snow in a single year [1].
The most recent event with widespread snow was that of storm Goretti, which brought major snowfall across parts of northern England, Wales and the Midlands. Values ranged from 8cm at Nottingham, up to unofficial reports of >20cm over high ground, and it caused major disruption for isolated villages in the Peak District. Another still in the minds of many would be the Beast from the East, a short spell of cold weather from a high pressure system that brought the cold and snowy conditions from the European continent over the UK back in February 2018. The maximum snowfall recorded from this event was >50 cm.
Snow mainly occurs during the winter and early spring, where air temperatures normally reach the required conditions. In fact, it is more likely to snow on Easter than Christmas, due to the UK’s atmospheric conditions at each time of year. Despite this, it can even snow in Summer! On June the 2nd, 1975, there was a large amount of snowfall over the Peak District, causing the stoppage of multiple county cricket matches [1]!
Snow depth website
When snow does fall in the UK, we like to see how much has fallen over certain areas. In order to make this possible, we have a website that allows the public to help by measuring snow depth at home and submitting reports to our community snow depth map: https://weatherquest.co.uk/snowdepth/map
If you would like to read some more about snow, head over to the references below:
A lot has changed in the forecasting world since WeatherQuest’s inception, with massive advancements in technology, understanding of processes and number/availability of observations. In this article we will be going through just a few of these developments made within meteorology.
Forecasting
Numerical Weather Prediction Models
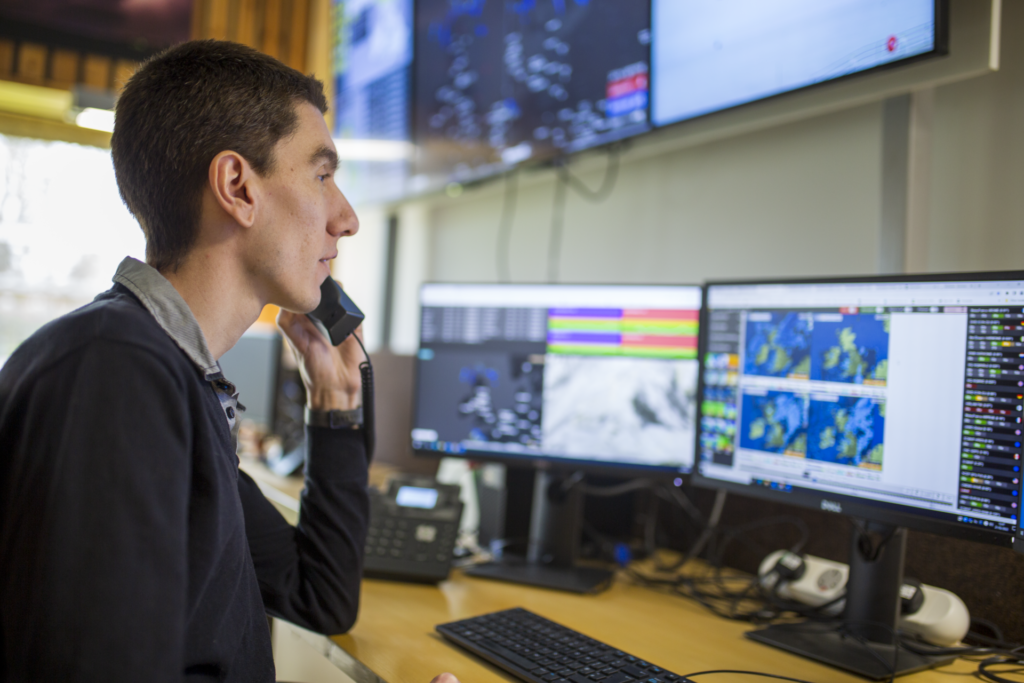
Numerical Weather Prediction (NWP) involves dividing the earth into a 3D grid and using supercomputers to ingest observations before running intricate mathematical models based on the dynamics and physics of the atmosphere. There are two main types of forecast model, Global and Regional. Global models produce a forecast for conditions over the whole earth at a relatively low resolution and are very useful for seeing large scale patterns and how they will develop. Regional models focus on smaller areas at a much higher resolution, enabling a much clearer localised forecast for users. WeatherQuest use both types of models, and depending on the location of our customer, our forecasters will look at multiple models to give the most accurate forecast they can.
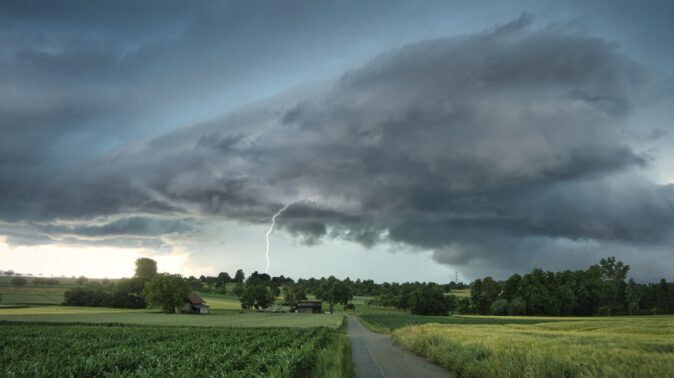
Back in the late 90s and early 00s global models were limited to a spatial resolution of between ~60-90 km, with regional models reaching ~12-15 km. With advancements and improvements to all aspects of the process over the years, the current Met Office equivalent models now run at ~10 km and 1.5 km respectively, providing much greater spatial accuracy in forecasts. Models have since also been “coupled” with the earth system, integrating the physical interactions between the atmosphere, ocean, cryosphere and land surface and how they influence meteorological phenomena downstream, further increasing their accuracy. One example of this are convection-permitting models, which can be used to simulate the development of convective thunderstorms at incredibly fine spatial and temporal resolutions, aiding in rainfall/flood and lightning forecasting.
(Met Office, History of numerical weather prediction, 2026)
Ensemble Forecasting
Despite being first developed in the 1970s, ensemble forecasting has seen massive improvements over the last 25 years. An ensemble forecast works by combining multiple NWP models with slightly differing starting conditions, leading to a model spread of various likely weather outcomes. Where these outcomes more closely agree, there is higher confidence in the forecast for those specific conditions occurring. As computer power has increased, so has the ability to include more models and at higher resolutions into these ensembles. The European Centre for Medium-Range Weather Forecasting (ECMWF) is a world leading producer of ensemble forecasts, and back in the early nineties, their ensembles had 33 models and a resolution of 210 km. With many upgrades since then, the numbers now stand at 51 models with a resolution of 9 km, gaining a skilful forecast lead time of around 1.5 days every decade; the current 9-day ensemble forecast is as useful as the 5-day forecast was back in 1998. WeatherQuest use these ensembles for our forecasts beyond seven days, providing both the extremes and the most likely values for each day. We also use them for our monthly and subseasonal forecasts, stretching out to 28 days ahead.
(ECMWF, 2022)
Observations
Observations are one of the most important aspects of weather forecasting, with many different kinds used within the industry. Two vital applications of observations include providing current conditions for models to use in forecast runs and allowing forecast verification by comparing past forecasts to the observed conditions. WeatherQuest use observations daily to intervene on warnings, verify and edit our forecasts and produce climatologies for a wide range of customers. So, what’s changed?
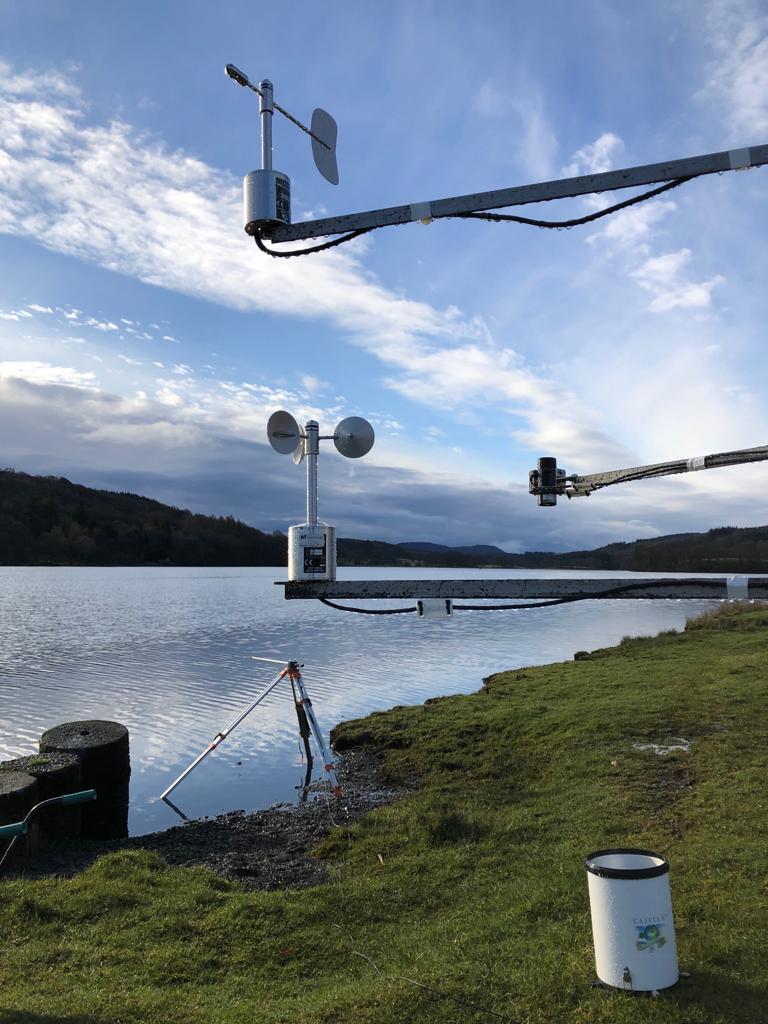
Stations
Many weather stations in the 90s were still relying on the manual logging of observations, where on-site staff would record the current conditions and enter them manually into a database. Since then, automated weather stations have become the norm, allowing for greater measurement frequency and reliability. Combining this with the fact that instruments and logging systems have undergone constant improvements, precision and accuracy has also increased. This has greatly helped in climatological studies and use of past weather data, ensuring a consistent and timely stream of weather conditions.
(Met Office, The UK land observation network, 2026)
Satellites
Since the 2000s there has also been a major increase in high resolution satellite observations, with the sector still making rapid and large developments today. They come in the form of Geostationary (a persistent picture of the same point above earth), and polar orbiting (providing swathes of images at much higher resolution) satellites, and can measure an ever-increasing array of variables. This helps cover some ground where land-based observations cannot be made. For example, large areas of Africa have seen little to no introduction of land-based stations, with some areas actually having a decline in station density. One of the simplest but most powerful tools is visible light satellite imagery (basically a near-live photo of the earth from space). This allows meteorologists to compare cloud patterns to real-time observations including rainfall, temperature and wind and increase confidence in their forecasts.
(Smith & Ward, 2025)
Radar
Radar was first introduced back in WW2 with the aim of detecting the location of enemy aircraft by pulsing out electro-magnetic waves and listening for an echo. After the war, the technology turned to focus on a more meteorological application of detecting precipitation. Initially the technology could only determine the location of the precipitation, but by the 1970s, doppler radars were installed across the UK. Doppler radars send out two short pulsed horizontally polarised electromagnetic waves, which bounce off any form of precipitation and return to the receiver. It then subtracts the second pulse from the first to determine not only the location, but also the intensity/rate of the precipitation.
Since the 00s, a new technology for radar has emerged, dual polarisation. Working in a similar way to doppler radars, dual polarisation radars also send out a vertical pulse. By using computer technology to combine both the horizontal and vertical, it forms a cross-section that can be used to determine precipitation type, and size. This also allows for better differentiation between precipitation and non-precipitation phenomena, and therefore the accuracy of the radar overall. WeatherQuest utilise radar data in our own WQRadar web application and in rainfall tracking sections on our client portals.
(Met Office, National Meteorological Library and Archive, 2023)
(NOAA National Severe Storms Laboratory, 2026)
Public Observations
Weather stations have also become cheaper and more readily available, not just for companies and businesses, but also for the public. With many more people owning different weather sensors, public observations can therefore contribute to broader networks and help detect patterns in more localised weather. Despite this, it is incredibly difficult to verify public sensors, and so public networks can include unreliable observations. Public observations don’t have to involve sensors either, as with some simple instructions, reports can be made into many different citizen science projects. In fact, WeatherQuest uses public observations in our snow depth report map, to help the public see which areas in the UK have the deepest snow: https://weatherquest.co.uk/snowdepth/map.
Argo programme
One of the largest increases in global observations was the deployment of Argo floats, an array of temperature, salinity and current profiling buoys dotted around the world’s seas and oceans. Beginning in 1999, 3000 floats were deployed by November 2007, with the current number being around 4000 floats. Although the floats don’t measure surface air temperature, sea surface temperatures (SSTs) play one of the largest roles in generating and affecting our weather through ocean-atmosphere interactions. In fact, large-scale systems such as the El Niño Southern Oscillation (ENSO) are primarily driven by SSTs, and ENSO is known for affecting global temperatures and large-scale regional rainfall patterns. SSTs are also the driving force behind hurricanes/typhoons/tropical cyclones and more localised low pressure storms. With this SST data, forecasting at both mesoscale (1-1000 km) and synoptic scale (>1000 km) has become much more reliable and accurate.
(Argo Programme, 2026)
New Advances
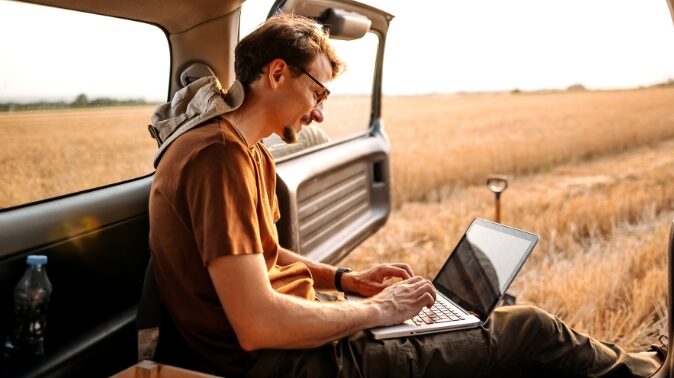
There are many current large-scale developments occurring in the world of meteorology. Most notably (as with a lot of other sectors) is the integration of Artificial Intelligence (AI) and Machine Learning (ML) technologies. Although traditional models are physics-based, newer AI/ML models are trained on vast arrays of past data to determine patterns and relationships and use them in their forecasts. This means that AI/ML forecasts can be run faster and on significantly lower powered machinery with GPUs, instead of the large-scale supercomputer CPUs. This can allow meteorological agencies in developing countries to generate useful and accurate forecasts for their populace. In fact, it’s not just limited to countries and meteorological agencies, as some large companies including Google, Huawei and Nvidia have begun to produce deep learning models that produce forecasts. Many current AI/ML forecasts are beginning to become competitive in the short- to medium-range forecast period, whilst others provide long-term/climate based projections.
Where AI really shines in the world of meteorology is its use in nowcasting. To produce a nowcast, current high frequency observations/datasets (such as those from radar and satellites) and short-range forecasts are combined by models to produce a forecast for the conditions of the next 0-6 hours in a very high spatial resolution. This is extremely helpful for those working in disaster prevention and aid, generating far more accurate flood warnings or tornado path projection for example. Nowcasting could also be used by those whose operations are tied to conditions with exact cut-off thresholds, who want to operate as much as possible on very marginal days.
Although AI/ML forecasts are making huge advancements, our changing climate is a limitation. Models need to be trained on historical observations and as our weather becomes more extreme, into conditions not previously seen, AI/ML forecasts may not forecast these extreme conditions accurately, something traditional NWP models may be able to do. This is a great argument for why AI/ML forecasts are a great supplement to standard NWP models, and why both should continue to be developed as we head into the future.
(Jean, et al., 2025)
Conclusion
The field of meteorology is constantly evolving, and new insights, models, processes and datasets are always being studied and developed. With each new progression, more studies and applications appear, and before long a groundbreaking technique becomes the new norm. So much has changed over the last 25 years, it is impossible to say where meteorology will be after the next 25, but wherever the sector is headed, WeatherQuest is eager to be there.
References
Argo Programme. (2026, May 12). Argo Program. Retrieved from NOAA AOML: https://www.aoml.noaa.gov/argo/
ECMWF. (2022, November 24). 30 years of ensemble forecasting at ECMWF. Retrieved from ECMWF Media Centre: https://www.ecmwf.int/en/about/media-centre/focus/2022/30-years-ensemble-forecasting-ecmwf
Jean, M., Pappenberger, F., Chan, P. W., Bouchet, V., Stav, N., & Honda, Y. (2025, October 13). Forecasting the Future: The Role of Artificial Intelligence in Transforming Weather Prediction and Policy. Retrieved from World Meteorological Organization: https://wmo.int/media/magazine-article/forecasting-future-role-of-artificial-intelligence-transforming-weather-prediction-and-policy
Met Office. (2023). National Meteorological Library and Archive. Retrieved from Met Office: https://www.metoffice.gov.uk/binaries/content/assets/metofficegovuk/pdf/research/library-and-archive/library/publications/factsheets/factsheet_15-weather-radar-2020_2023.pdf
Met Office. (2026, May 12). History of numerical weather prediction. Retrieved from Met Office: How weather forecasts are created: https://weather.metoffice.gov.uk/learn-about/how-forecasts-are-made/history-of-numerical-weather-prediction
Met Office. (2026, May 12). The UK land observation network. Retrieved from Met Office: https://weather.metoffice.gov.uk/guides/observations/uk-observations-network
NOAA National Severe Storms Laboratory. (2026, May 12). Research Tools: Dual Polarized Radar. Retrieved from NOAA NSSL: https://www.nssl.noaa.gov/tools/radar/dualpol/
Smith, M., & Ward, A. (2025, December 22). Sentinels in the Sky: 50 Years of GOES Satellite Observations. Retrieved from NASA: https://science.nasa.gov/science-research/earth-science/sentinels-in-the-sky-50-years-of-goes-satellite-observations/
Royal Meteorological Society Professional Accreditation
We are incredibly proud to announce that our meteorologists have been awarded either Registered Meteorologist (RMet) or Chartered Meteorologist (CMet) accreditation from the Royal Meteorological Society!
Over the last few years we have been supporting our meteorologists in their progress to achieve professional accreditation from the Royal Meteorological Society. Achieving professional accreditation demonstrates our staff’s competency and credibility within the field of meteorology, whilst also bolstering their career through continuous professional development.
A big congratulations to those below for their amazing and well-deserved achievement!
On the 6th of January 2026, a low-pressure system began to develop out in the Atlantic. Starting off at ~1020 hPa, it was named Storm Goretti by Météo-France, as the most severe wind impacts were initially forecast for northern France. The low was pushed above the Azores high block, with its trajectory towards the Channel. By midday on the 7th of January, the low (shown in the blue ring below) deepened to 1017 hPa, and the Met Office issued Yellow and Amber weather warnings for wind, rain, snow and ice for large areas of the UK.
Main event
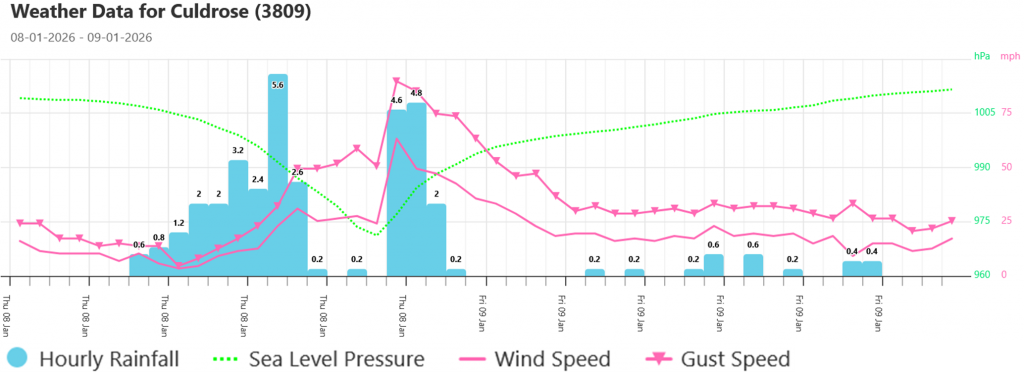
At midnight (00:00) on the 8th of January, the low deepened to 1006 hPa and was strengthening rapidly, losing 2 hPa every hour, reaching 994 hPa by 06:00. Due to its strength and trajectory, the Met Office upgraded their warnings to include a red warning for the Isles of Scilly and parts of Cornwall, and several amber warnings for western parts of the country and the Midlands.
By the evening, the storm travelled directly over Cornwall, with peak winds of 99 mph being recorded at St Mary’s Airport on the Isles of Scilly. The time series from Culdrose weather station, Cornwall, shows how sudden the drop in pressure was, reaching a low of 969 hPa, with the leading rain before and sharp wind gusts just after the centre of the low passed overhead. The highest wind gust recorded at this station was 90 mph.
The damaging high wind speeds can be explained not only by the position of the low, but also by the type; Strom Goretti was a textbook Shapiro-Keyser style cyclone. During a Shapiro-Keyser storm’s development, the cold front detaches from the leading warm front, allowing cool air from behind the cold front to rapidly sink, accelerate and wrap around warm front, potentially creating a sting jet of intense wind speeds. This detachment can be seen in the pressure chart for 18UTC on the 8th of January.
While the Southwest saw the brunt of the strong winds and rough seas along the coast, large amounts of snow fell across parts of northern England, Wales and the Midlands. Values ranged from 8cm at Nottingham, up to unofficial reports of >20cm over high ground. Across the South and the East, the main impact was a prolonged spell of rainfall. See the WQ Radar video below for a snapshot of the event.
Disruption
Winter windstorms can be very dangerous, and Goretti was a severe case. Below are just a few impacts the storm caused:
A man was unfortunately killed when a tree fell on his caravan in Helston.
>200,000 properties without power, 12,000 of which were still without power on Sunday the 11th.
The snow, combined with the mild weather after the storm meant there were many flood warnings and alerts in place all over the country.
Water mains pipes damaged by uprooting trees and freeze-thaw bursts, leaving around 30,000 properties without water.
Flights were cancelled and airports were shut down across the country.
Some cars and vans were overturned on some main roads.
We hope everyone stays safe during the storm season!
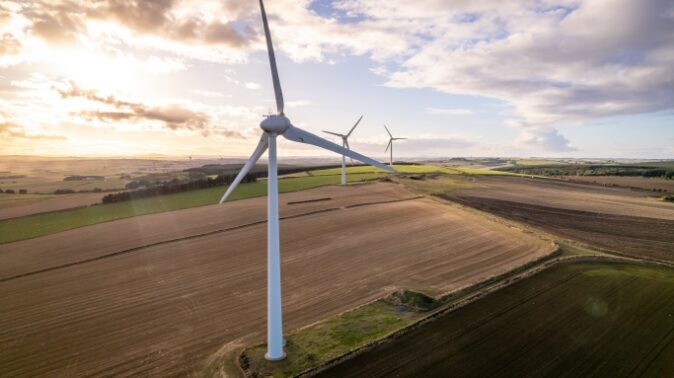
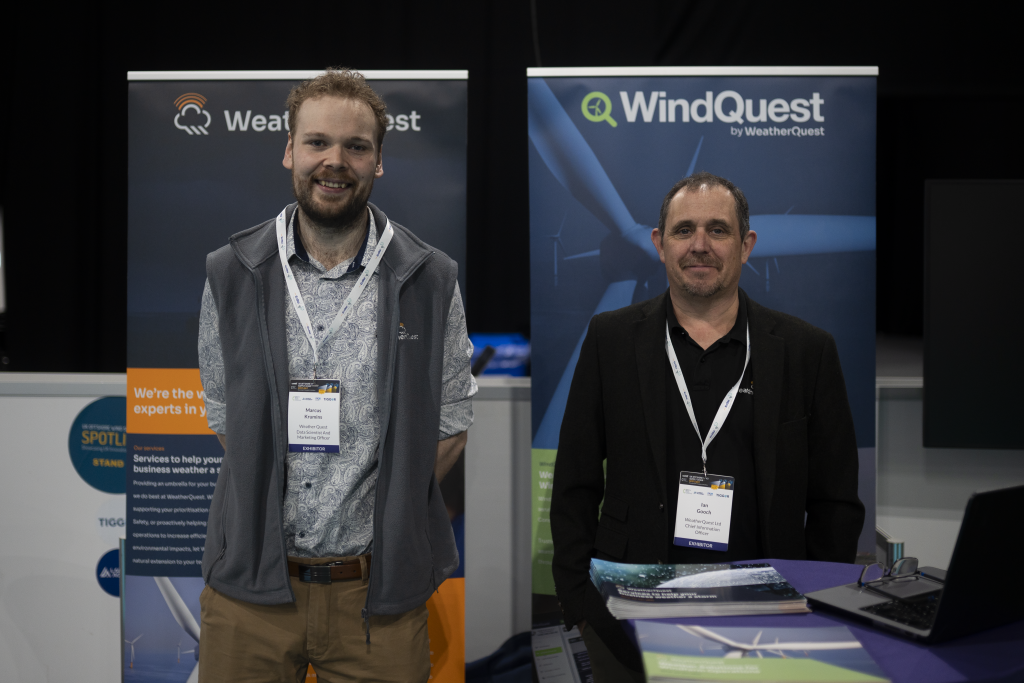
On the 10th of December, Ian, Morrie and Marcus headed up the Highland Hall, Royal Highland Centre, Edinburgh to take part in the UK Offshore Wind Supply Chain Spotlight 2025. Supported by the Fit 4 Offshore Renewables program, WeatherQuest were provided a stand at the event to showcase the Offshore Wind tailored services we provide and create innovative connections with others in the sector.
It was an early start, with the trio having set up the WeatherQuest stand by 08:00 ready for the delegate registration and entry beginning at 08:30 and the main event start at 09:00. Throughout the day, there were many great exciting conversations between delegates and the WeatherQuest team, providing some really exciting opportunities for future partnerships, projects and products.
Have a look below at some action shots taken by Morrie!
The day was a great success for us, and we thank the Offshore Renewable Energy Catapult and Offshore Wind Growth Partnership for providing us the opportunity to showcase what we do for the offshore industry and creating potential future links with others in the sector.
WQ Senior Meteorologist Ruby Warner took part in the PPL/IR Europe Spring Conference
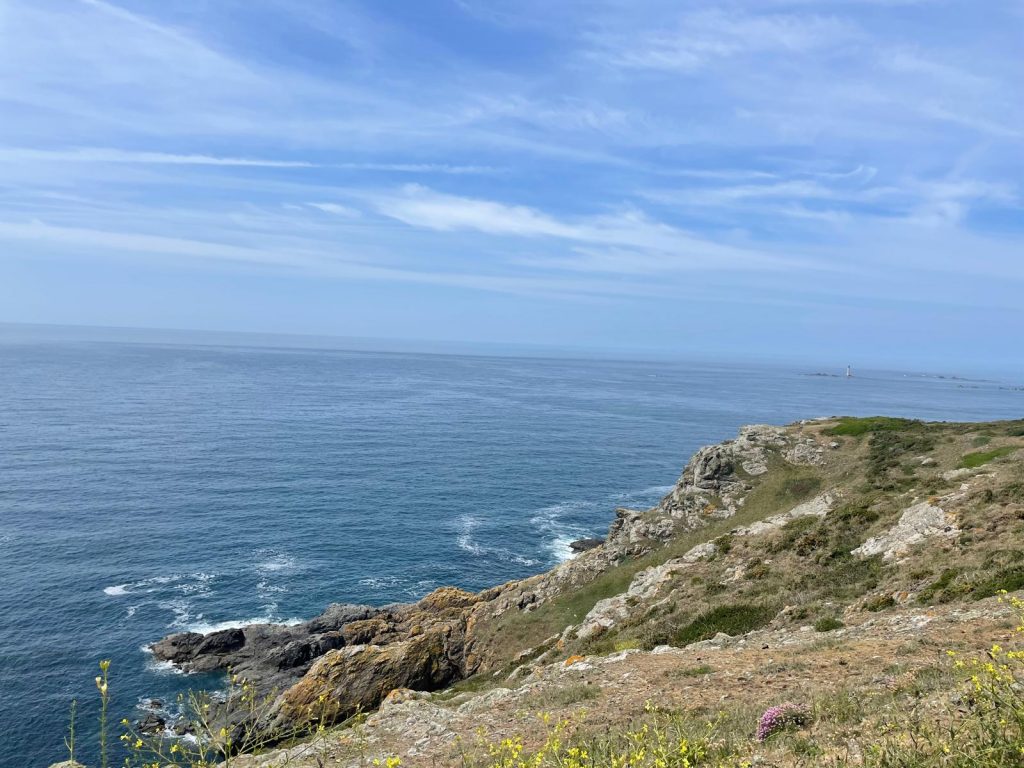
Over the bank holiday weekend of the 23rd – 25th of May, Ruby, one of our Senior forecasters, took a trip to the Private Pilot Instrument (PPL/IR Europe) flying community Spring conference on the Isle of Guernsey. PPL/IR Europe is a non-profit organisation that assists with achieving and maintaining instrument qualifications on aeroplanes under EASA and UK-CAA certification [1]. Ruby flew out to Guernsey on a small aircraft, with conditions being bright and sunny. Once landed, Ruby underwent a tour of the Guernsey and Herm islands, before reaching St Pierre Park Hotel where the conference was being held.
The following day, Ruby delivered three two-hour long breakout sessions covering several meteorological topics relevant to aviation, including mid-latitude cyclone development and understanding tephigrams. The sessions focused on aviation hazards such as convection and how lightning and hail is formed, as well as cloud structure and icing. Ruby also highlighted some useful opensource resources which can be used to help identify potential meteorological hazards and gain confidence in the forecast.
Ruby had a fantastic time overall and found it incredibly rewarding sharing knowledge on understanding the weather pilots may be flying in, making aviation safer for all! Thank you PPL/IR Europe for hosting and allowing Ruby to take part!
Ocean currents are incredibly important in maintaining climate stability around the world. One of the most important of these currents is the Atlantic Meridional Overturning Circulation (AMOC), which holds a vital role in the climate of the North Atlantic. Cold waters in the Arctic sink and flow southwards along the depths of the Atlantic, where they reach the Southern Ocean. Here, the circumpolar winds act as a “pump”, upwelling this water where it then begins to travel north. As the water does so, it gradually warms, providing areas such as the Caribbean and Gulf of Mexico with warm Sea Surface Temperatures. In the final leg of its loop, the current flows northeast across the North Atlantic (via the Gulf Stream), bringing warmer waters to Western Europe, before extending back up to the Arctic. This is one of the reasons the UK has milder winters relative to other countries at the same latitude.
The AMOC is also responsible for making the Atlantic one of the largest global carbon sinks. Upwelling from the deep ocean brings nutrients which supports phytoplankton and therefore photosynthesis at the surface, storing CO2 biologically. On top of this, the upwelling water is thousands of years old and contains far less CO2 than the surface water. When in contact with the atmosphere, this water absorbs large quantities of CO2 (DeVries and Primeau, 2011). These three climatic systems cement the AMOC as one of the most important global currents in the world.
Climate change and the AMOC
Among many statistical models, it has been forecasted that under global climate change, due to melting ice and warming global ocean temperatures, the AMOC will weaken and could even collapse and shut down by the mid-to-late-century. Due to the systems described above, this would have serious consequences for oceanic carbon uptake and heat transfer for regions around the world (Hu, 2025).
To further our understanding of the weakening AMOC, a joint Met Office and University of Exeter study by J. A. Baker et al. (2025) compared 34 CMIP6 climate models focusing on extreme greenhouse gas and North Atlantic freshwater forcing scenarios and their impacts on the AMOC. They found that across all models, the AMOC does not collapse, but levels off at differing weakened states depending on the model, and is sustained by the upwelling wind-driven “pump” of the Southern Ocean. Although this “pump” is modelled to strengthen in the chosen climate forcings, a Pacific Meridional Overturning Circulation (PMOC) begins to develop in the Indo-Pacific, taking away some of the volume of waters in the AMOC therefore weakening the overall circulation.
J. A. Baker et al. (2025) suggest the system is balanced by the water entering the circulation and the water leaving; in order for the AMOC to collapse, strong upwelling would need to be provided by another system, hence the development of the PMOC. The strengths of the PMOC from the models do not reach significant levels to completely compensate for a shut off the AMOC, hence only weakening it (Hu, 2025). Therefore, although an AMOC collapse this century is not likely, its weakening is dependent on the development of a PMOC, and how strong this circulation becomes.
Despite the findings that the AMOC may not collapse this century, even just a 50% weakening of the AMOC will still have massive global impacts due to the reduction in heat transport, nutrient circulation and carbon uptake of the ocean. Therefore, this modelled weakening must still be viewed as of high concern and the continued studying of the AMOC’s relationship to climate change is vital.
For more information, please visit the references below:
Baker, J.A., Bell, M.J., Jackson, L.C. et al. Continued Atlantic overturning circulation even under climate extremes. Nature638, 987–994 (2025). https://doi.org/10.1038/s41586-024-08544-0
DeVries, T., and F. Primeau. Dynamically and Observationally Constrained Estimates of Water-Mass Distributions and Ages in the Global Ocean. J. Phys. Oceanogr., 41, 2381–2401 (2011) https://doi.org/10.1175/JPO-D-10-05011.1
WeatherQuest has been awarded a contract to provide the PortQuest service to Baltic Hub over a three-year period (2025-2028)
The Baltic Hub (formerly DCT Gdańsk), is a container terminal located at the city of Gdańsk, Poland. Handling more than 700 vessels with 2.9 million TEUs annual throughput capacity, it is Poland’s largest terminal, and a hub for global trade.
They will harness PortQuest, our service tailored for the Ports and Marine industry, which provides a custom-designed online portal, short term hourly forecasts, probability based month long forecasts, specific weather warnings tailored to user thresholds and more.
The service will help Baltic Hub keep the operations at the terminal efficient by reducing weather related downtime, whilst also keeping the employees safe.
We are looking forward to working alongside and supporting Baltic Hub throughout this period.
To find out more about the Baltic Hub, head over to their website.
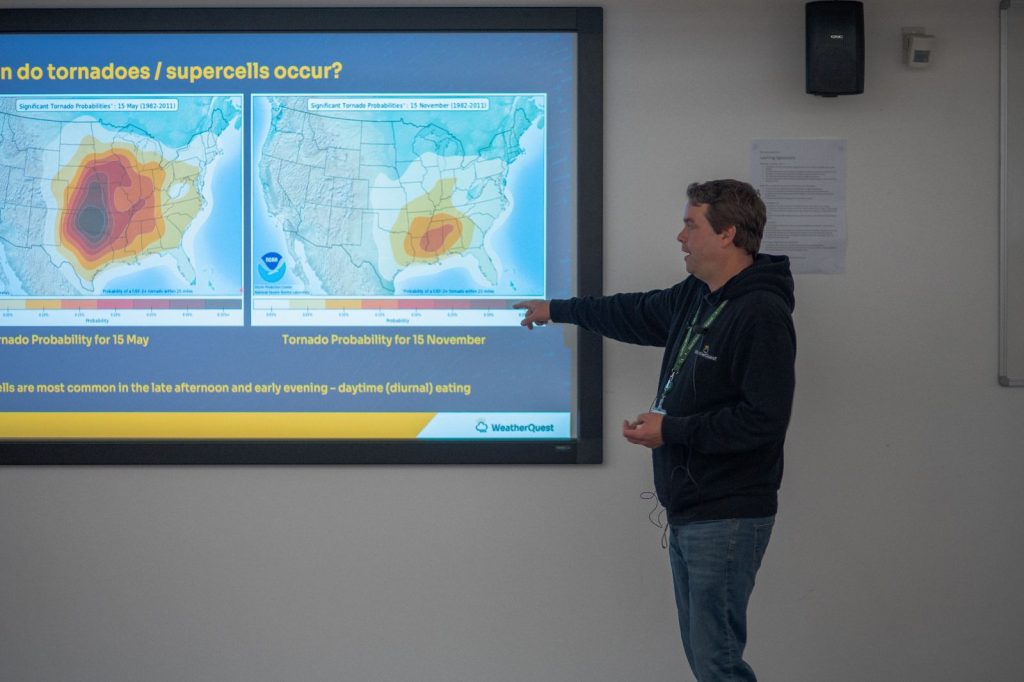
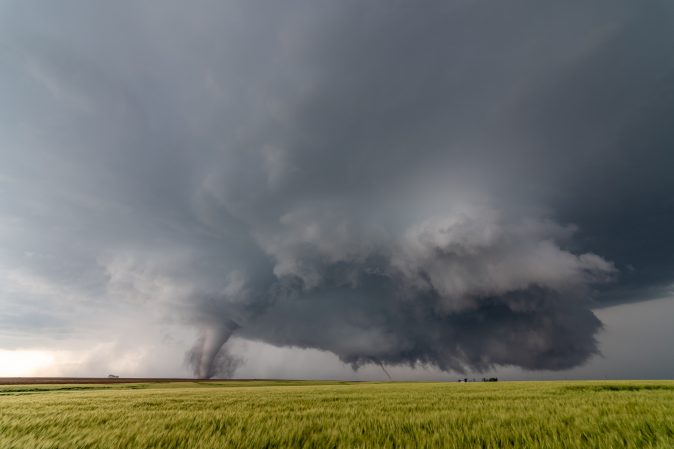
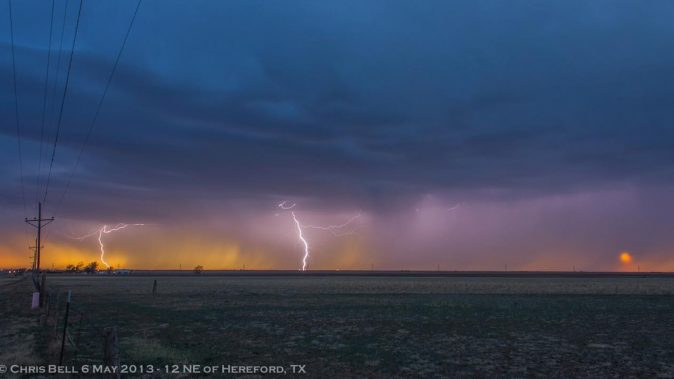
Thank you to all those who came to an incredibly fascinating talk about why Tornado Alley and the Great Plains are so unique in producing large-scale storms. Hearing the anecdotal stories from Chris, and seeing his fantastic images alongside was awesome (hearing the NOAA Tornado Warning was our highlight)!
After the success of this first talk, the RMetS East Anglia Centre already has two more booked in. The first of which, on the 4th of November at 6pm in the University Of East Anglia’s Julian Study Centre, is a talk from the East Anglia Centre’s very own chairs, Berna McCaffrey and James Lester, about their journey from being students all the way to working as operational meteorologists. If you are a student looking to get into meteorology, this is definitely one for you!
The next, on the 2nd December, will be about how to hunt the Aurora Borealis (the Northern Lights) here in the UK. Led by James Rowley-Hill (who runs Aurora UK Facebook group), the talk will cover a basic understanding of reading and the interpreting the solar wind, how it is used to predict aurora, and some simple camera tips to help you capture some stunning photos of the lights themselves. With the number of times they has been visible recently, it is definitely a hot topic, and we can’t wait to hear how to improve our Aurora sighting bragging snaps!
We hope to see you there!For any more information regarding upcoming RMetS East Anglia Centre local events, please head to their website on the link below.
The Royal Meteorological Society East Anglia Local Centre is making a comeback! Two of our WeatherQuest forecasters (James Lester and Bernadette McCaffrey) are relaunching the Royal Meteorological Society’s (RMetS) East Anglia Centre this autumn. The Centre will meet 6 times a year, with topics aimed to meet a broad range of subjects from across meteorology and climate. Each meeting will be free of charge, and available to members and non-members. Professional meteorologists (working or retired), under- and postgraduate students, or members of the public with an interest in all things meteorology and climate, all are welcome!
The first talk, hosted at the University of East Anglia’s Julian Study Centre on the 7th of October, is from our very own Chief Communication Officer – Chris Bell. The talk will focus on Storm Chasing in the American Great Plains, and what makes them so unique for producing such large storms and tornadoes. Despite residing here in the UK, Chris grew up in Texas and has made many a trip back to the USA to chase storms through the infamous “Tornado Alley” of the Great Plains. Chris will talk about his own experience in storm chasing, where, why and how people do it, and then delve into the science behind the storms, explaining how they are produced, and what time of year these large supercells/tornadoes normally occur. With his experience in forecasting, meteorology and storm chasing, it is looking to be a fascinating talk!
To find out more and register for the event, please visit the event page on the RMetS website via this link. More events will be planned before the end of the year which will be announced in due course and added to the Local Centre’s webpage (see link below).
Thank you to James and Bernadette for putting in the work to bring regular meetings back to this local Centre. We are looking forward to see what else the RMetS Anglian Centre has in store!