During our 25th Anniversary celebrations, we thought we should celebrate the weird and wonderful world that is the weather by going through some of our favourite weather phenomena. In this sub-series of articles, we will be going into the details of how they are produced and provide some examples.
As a nice start to the series, we will be looking at quite a few peoples’ favourite, snow!
What is it?
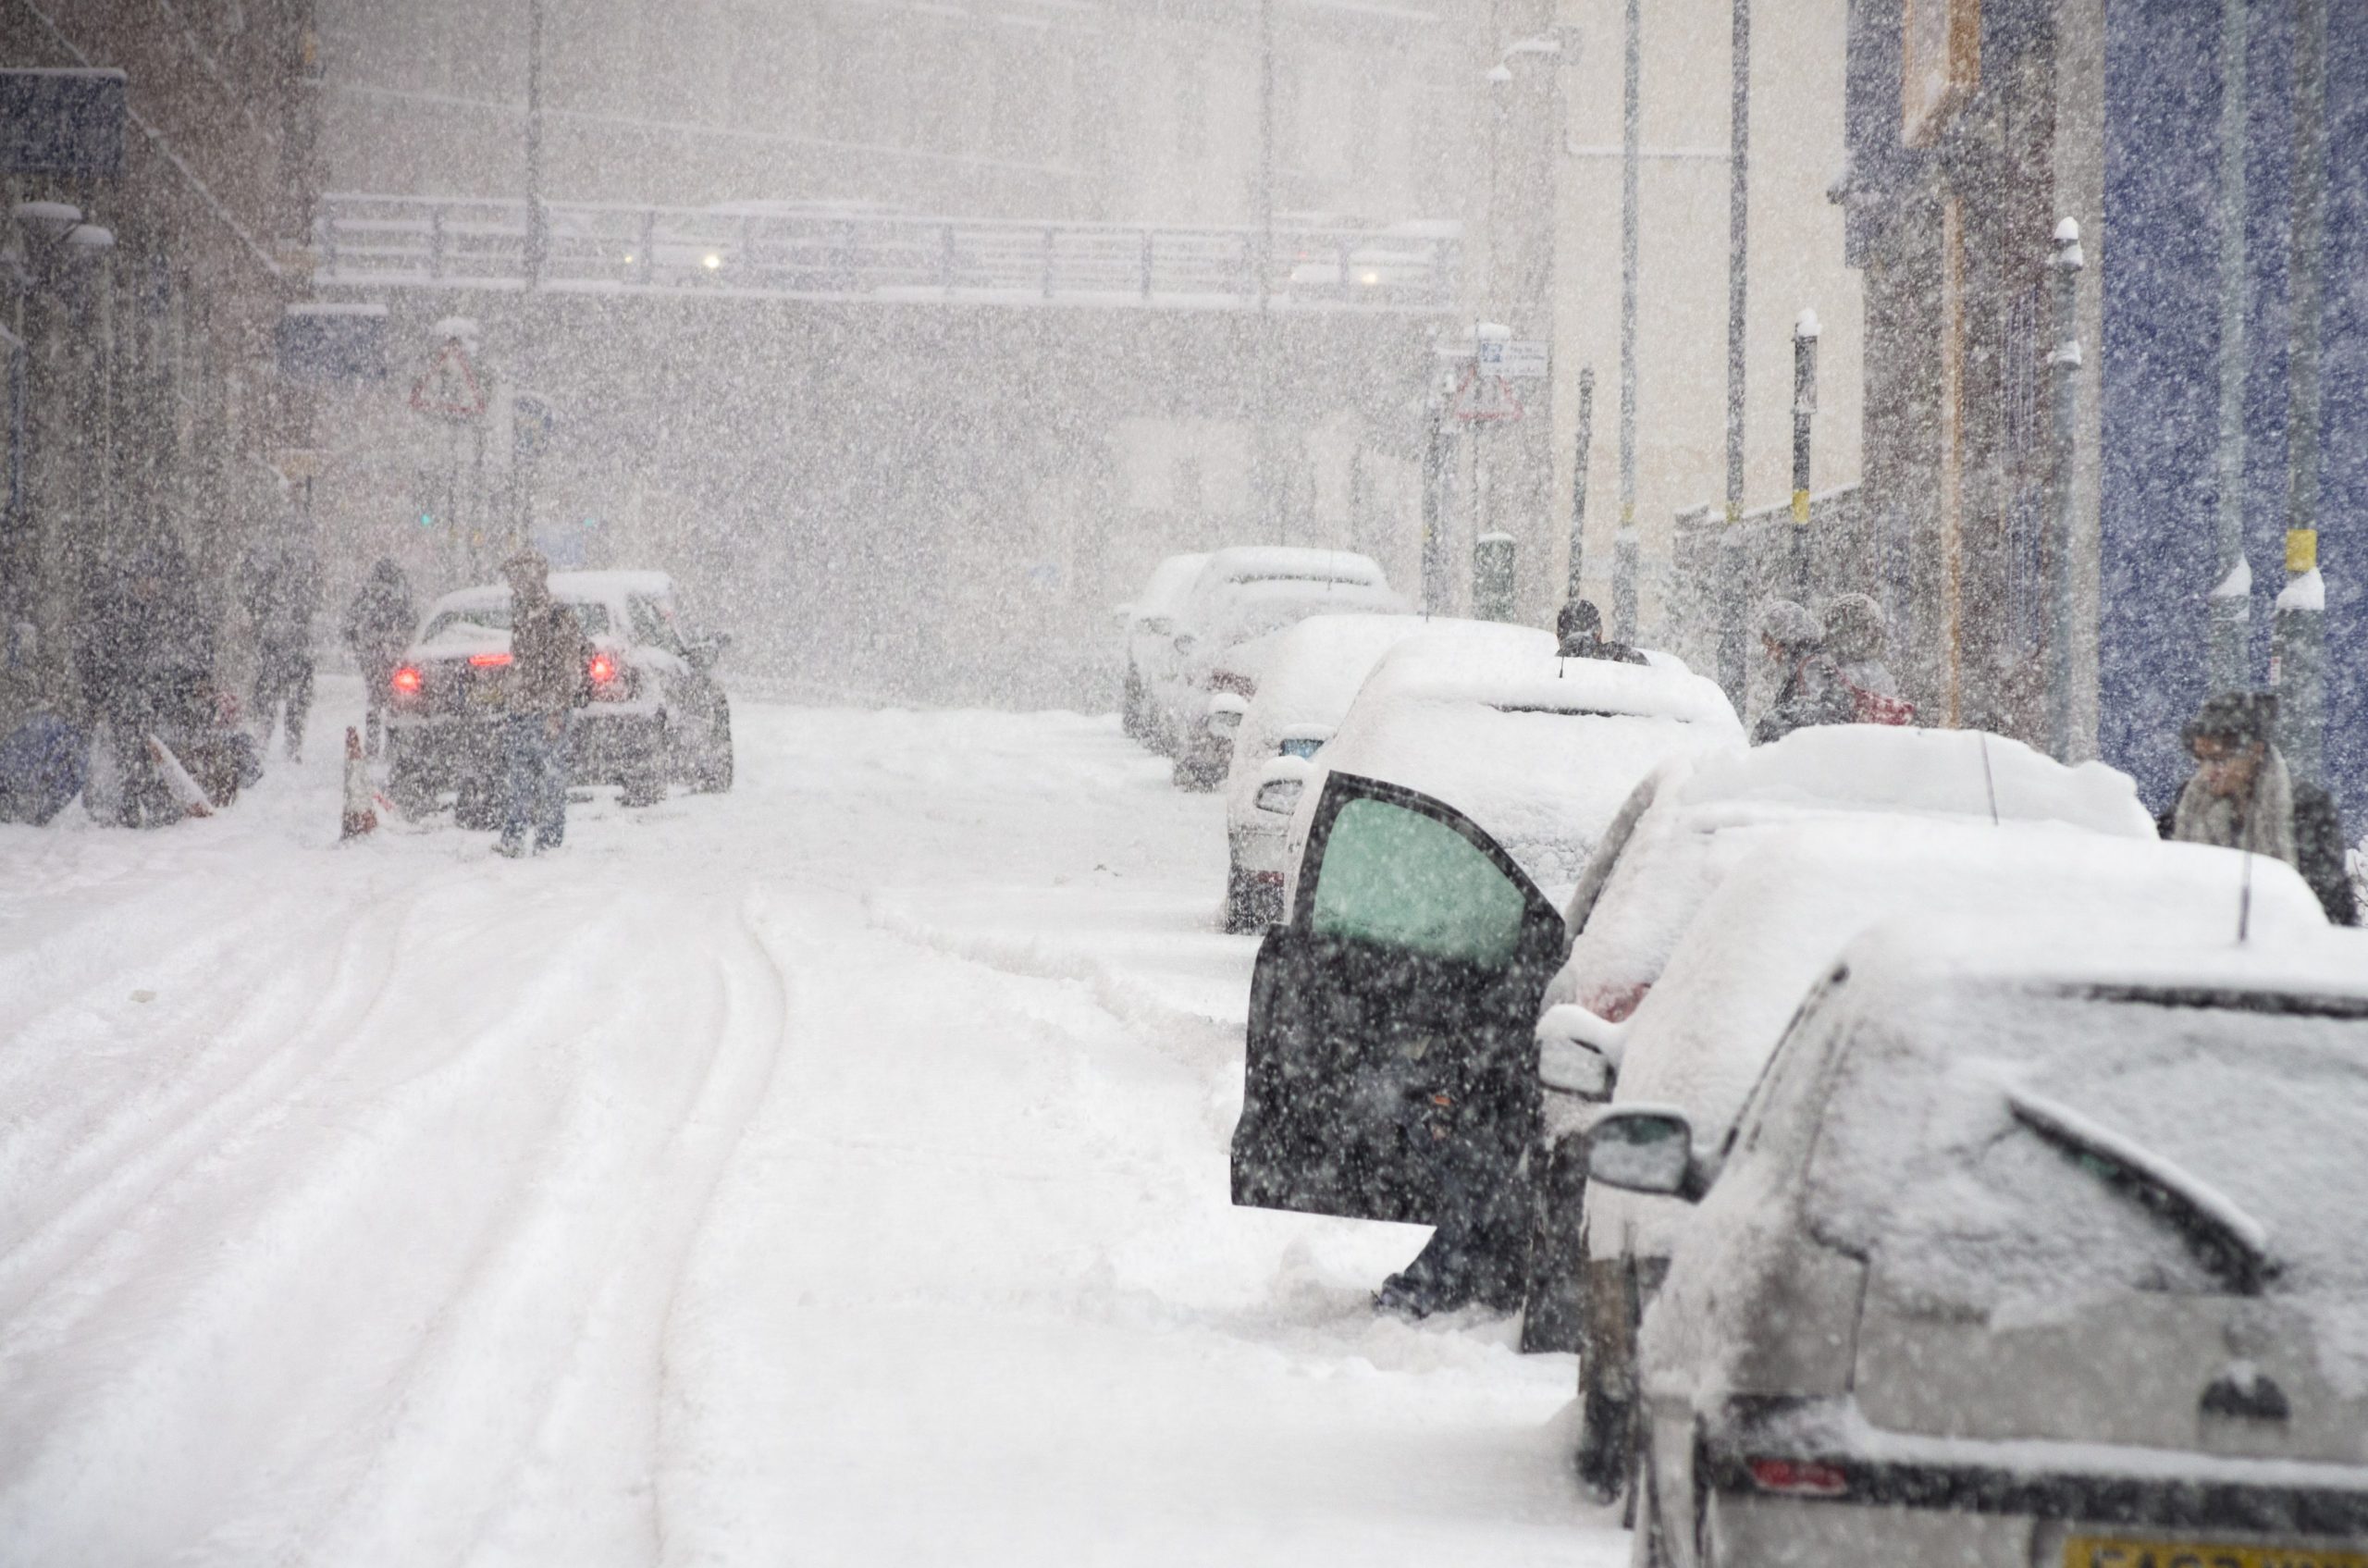
Snow is one of most transformative weather conditions we have in the UK, making the environment look completely different when it settles. Depending on where it falls, and how much, it can cause disruption for many.
Snow is the collective term for small ice crystals that stick together, and is formed when moisture in the atmosphere (usually within clouds) freezes during air temperatures of below 2 °C. Once frozen and of a critical mass, the snow begins to fall, normally between 1-4mph, depending on flake density and wind strength [1]. In meteorology we use three different terms to describe snowfall: slight, moderate and heavy – all of which are measured by the visibility during their snowfall, at >1 km, between 0.5 – 1 km, and <0.5 km respectively [2].
The size of the crystals/flakes is proportional to the temperature of the air in which it falls, with warmer air forming larger flakes due to them melting and sticking together more easily. These larger flakes settle and clump together more easily on the ground and are therefore much greater for creating snowmen and snowballs. This is known meteorologically as wet snow. Dry snow occurs when the air temperature is much colder and drier, forming smaller flakes. These flakes are less likely to clump together and so form a dustier snow cover that can be blown in the wind. This form of snow is favoured for winter sports such as skiing [1].
How often and how much?
The annual occurrence of snowy weather changes depending on the location within the UK. Often areas further north and of higher ground tend to see more snow throughout the year (Scottish Highlands), with the opposite occurring for the South and lower lying areas. On average however, the UK sees ~13 days of lying snow in a single year [1].
The most recent event with widespread snow was that of storm Goretti, which brought major snowfall across parts of northern England, Wales and the Midlands. Values ranged from 8cm at Nottingham, up to unofficial reports of >20cm over high ground, and it caused major disruption for isolated villages in the Peak District. Another still in the minds of many would be the Beast from the East, a short spell of cold weather from a high pressure system that brought the cold and snowy conditions from the European continent over the UK back in February 2018. The maximum snowfall recorded from this event was >50 cm.
Snow mainly occurs during the winter and early spring, where air temperatures normally reach the required conditions. In fact, it is more likely to snow on Easter than Christmas, due to the UK’s atmospheric conditions at each time of year. Despite this, it can even snow in Summer! On June the 2nd, 1975, there was a large amount of snowfall over the Peak District, causing the stoppage of multiple county cricket matches [1]!
Snow depth website
When snow does fall in the UK, we like to see how much has fallen over certain areas. In order to make this possible, we have a website that allows the public to help by measuring snow depth at home and submitting reports to our community snow depth map: https://weatherquest.co.uk/snowdepth/map
If you would like to read some more about snow, head over to the references below:
A lot has changed in the forecasting world since WeatherQuest’s inception, with massive advancements in technology, understanding of processes and number/availability of observations. In this article we will be going through just a few of these developments made within meteorology.
Forecasting
Numerical Weather Prediction Models
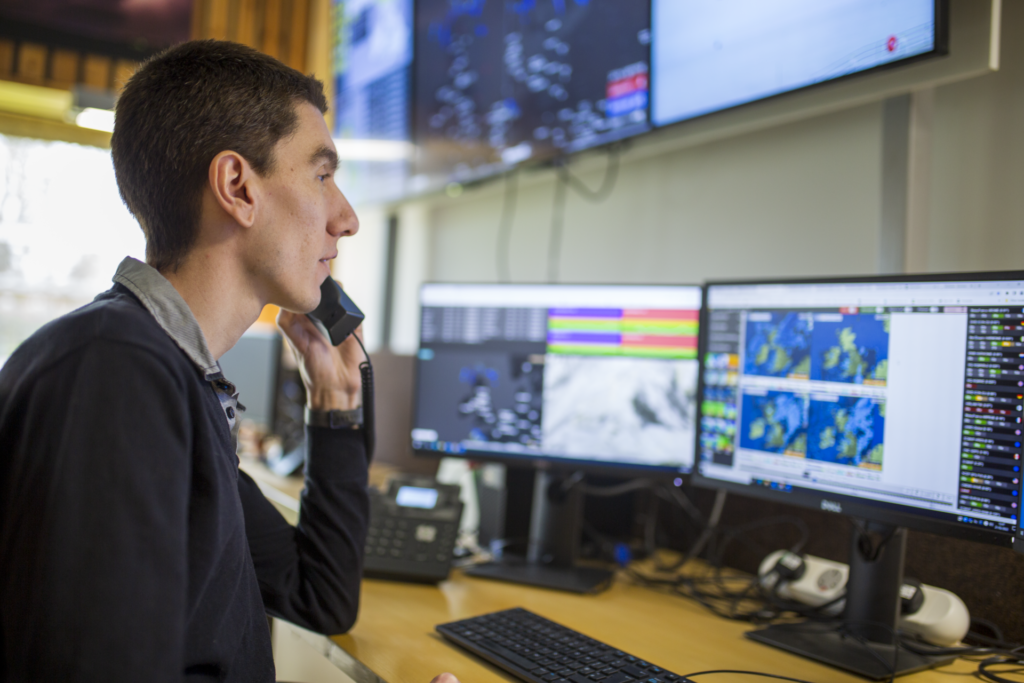
Numerical Weather Prediction (NWP) involves dividing the earth into a 3D grid and using supercomputers to ingest observations before running intricate mathematical models based on the dynamics and physics of the atmosphere. There are two main types of forecast model, Global and Regional. Global models produce a forecast for conditions over the whole earth at a relatively low resolution and are very useful for seeing large scale patterns and how they will develop. Regional models focus on smaller areas at a much higher resolution, enabling a much clearer localised forecast for users. WeatherQuest use both types of models, and depending on the location of our customer, our forecasters will look at multiple models to give the most accurate forecast they can.
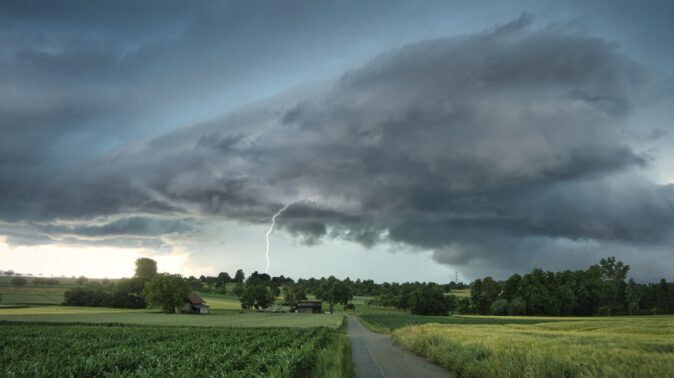
Back in the late 90s and early 00s global models were limited to a spatial resolution of between ~60-90 km, with regional models reaching ~12-15 km. With advancements and improvements to all aspects of the process over the years, the current Met Office equivalent models now run at ~10 km and 1.5 km respectively, providing much greater spatial accuracy in forecasts. Models have since also been “coupled” with the earth system, integrating the physical interactions between the atmosphere, ocean, cryosphere and land surface and how they influence meteorological phenomena downstream, further increasing their accuracy. One example of this are convection-permitting models, which can be used to simulate the development of convective thunderstorms at incredibly fine spatial and temporal resolutions, aiding in rainfall/flood and lightning forecasting.
(Met Office, History of numerical weather prediction, 2026)
Ensemble Forecasting
Despite being first developed in the 1970s, ensemble forecasting has seen massive improvements over the last 25 years. An ensemble forecast works by combining multiple NWP models with slightly differing starting conditions, leading to a model spread of various likely weather outcomes. Where these outcomes more closely agree, there is higher confidence in the forecast for those specific conditions occurring. As computer power has increased, so has the ability to include more models and at higher resolutions into these ensembles. The European Centre for Medium-Range Weather Forecasting (ECMWF) is a world leading producer of ensemble forecasts, and back in the early nineties, their ensembles had 33 models and a resolution of 210 km. With many upgrades since then, the numbers now stand at 51 models with a resolution of 9 km, gaining a skilful forecast lead time of around 1.5 days every decade; the current 9-day ensemble forecast is as useful as the 5-day forecast was back in 1998. WeatherQuest use these ensembles for our forecasts beyond seven days, providing both the extremes and the most likely values for each day. We also use them for our monthly and subseasonal forecasts, stretching out to 28 days ahead.
(ECMWF, 2022)
Observations
Observations are one of the most important aspects of weather forecasting, with many different kinds used within the industry. Two vital applications of observations include providing current conditions for models to use in forecast runs and allowing forecast verification by comparing past forecasts to the observed conditions. WeatherQuest use observations daily to intervene on warnings, verify and edit our forecasts and produce climatologies for a wide range of customers. So, what’s changed?
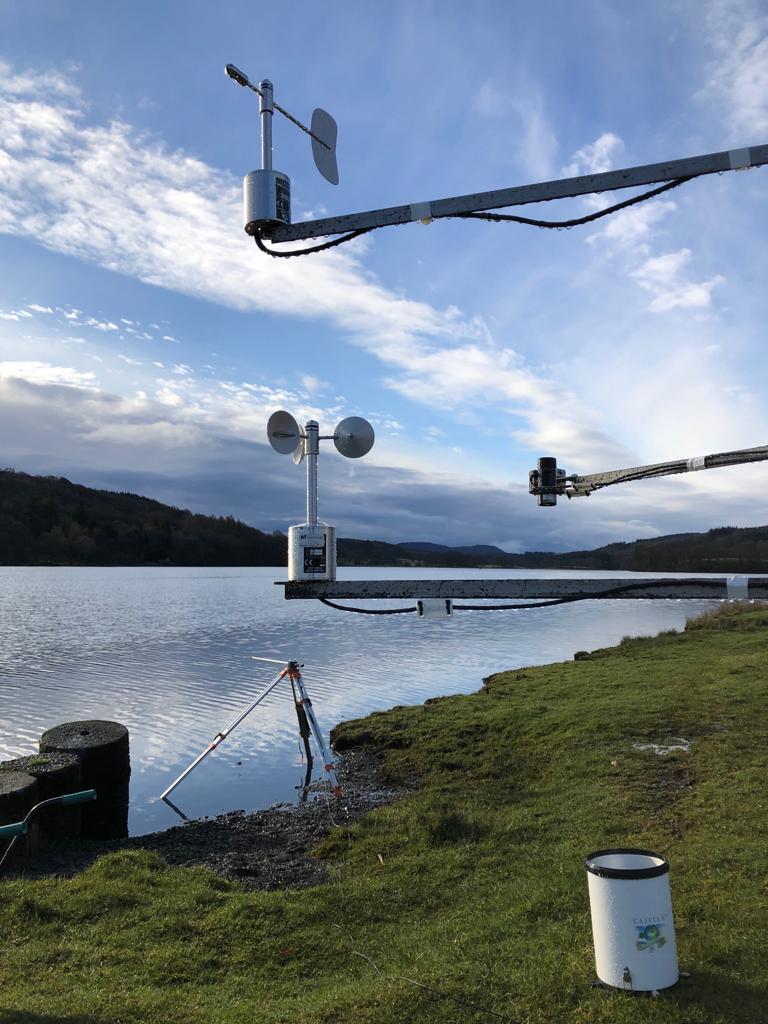
Stations
Many weather stations in the 90s were still relying on the manual logging of observations, where on-site staff would record the current conditions and enter them manually into a database. Since then, automated weather stations have become the norm, allowing for greater measurement frequency and reliability. Combining this with the fact that instruments and logging systems have undergone constant improvements, precision and accuracy has also increased. This has greatly helped in climatological studies and use of past weather data, ensuring a consistent and timely stream of weather conditions.
(Met Office, The UK land observation network, 2026)
Satellites
Since the 2000s there has also been a major increase in high resolution satellite observations, with the sector still making rapid and large developments today. They come in the form of Geostationary (a persistent picture of the same point above earth), and polar orbiting (providing swathes of images at much higher resolution) satellites, and can measure an ever-increasing array of variables. This helps cover some ground where land-based observations cannot be made. For example, large areas of Africa have seen little to no introduction of land-based stations, with some areas actually having a decline in station density. One of the simplest but most powerful tools is visible light satellite imagery (basically a near-live photo of the earth from space). This allows meteorologists to compare cloud patterns to real-time observations including rainfall, temperature and wind and increase confidence in their forecasts.
(Smith & Ward, 2025)
Radar
Radar was first introduced back in WW2 with the aim of detecting the location of enemy aircraft by pulsing out electro-magnetic waves and listening for an echo. After the war, the technology turned to focus on a more meteorological application of detecting precipitation. Initially the technology could only determine the location of the precipitation, but by the 1970s, doppler radars were installed across the UK. Doppler radars send out two short pulsed horizontally polarised electromagnetic waves, which bounce off any form of precipitation and return to the receiver. It then subtracts the second pulse from the first to determine not only the location, but also the intensity/rate of the precipitation.
Since the 00s, a new technology for radar has emerged, dual polarisation. Working in a similar way to doppler radars, dual polarisation radars also send out a vertical pulse. By using computer technology to combine both the horizontal and vertical, it forms a cross-section that can be used to determine precipitation type, and size. This also allows for better differentiation between precipitation and non-precipitation phenomena, and therefore the accuracy of the radar overall. WeatherQuest utilise radar data in our own WQRadar web application and in rainfall tracking sections on our client portals.
(Met Office, National Meteorological Library and Archive, 2023)
(NOAA National Severe Storms Laboratory, 2026)
Public Observations
Weather stations have also become cheaper and more readily available, not just for companies and businesses, but also for the public. With many more people owning different weather sensors, public observations can therefore contribute to broader networks and help detect patterns in more localised weather. Despite this, it is incredibly difficult to verify public sensors, and so public networks can include unreliable observations. Public observations don’t have to involve sensors either, as with some simple instructions, reports can be made into many different citizen science projects. In fact, WeatherQuest uses public observations in our snow depth report map, to help the public see which areas in the UK have the deepest snow: https://weatherquest.co.uk/snowdepth/map.
Argo programme
One of the largest increases in global observations was the deployment of Argo floats, an array of temperature, salinity and current profiling buoys dotted around the world’s seas and oceans. Beginning in 1999, 3000 floats were deployed by November 2007, with the current number being around 4000 floats. Although the floats don’t measure surface air temperature, sea surface temperatures (SSTs) play one of the largest roles in generating and affecting our weather through ocean-atmosphere interactions. In fact, large-scale systems such as the El Niño Southern Oscillation (ENSO) are primarily driven by SSTs, and ENSO is known for affecting global temperatures and large-scale regional rainfall patterns. SSTs are also the driving force behind hurricanes/typhoons/tropical cyclones and more localised low pressure storms. With this SST data, forecasting at both mesoscale (1-1000 km) and synoptic scale (>1000 km) has become much more reliable and accurate.
(Argo Programme, 2026)
New Advances
There are many current large-scale developments occurring in the world of meteorology. Most notably (as with a lot of other sectors) is the integration of Artificial Intelligence (AI) and Machine Learning (ML) technologies. Although traditional models are physics-based, newer AI/ML models are trained on vast arrays of past data to determine patterns and relationships and use them in their forecasts. This means that AI/ML forecasts can be run faster and on significantly lower powered machinery with GPUs, instead of the large-scale supercomputer CPUs. This can allow meteorological agencies in developing countries to generate useful and accurate forecasts for their populace. In fact, it’s not just limited to countries and meteorological agencies, as some large companies including Google, Huawei and Nvidia have begun to produce deep learning models that produce forecasts. Many current AI/ML forecasts are beginning to become competitive in the short- to medium-range forecast period, whilst others provide long-term/climate based projections.
Where AI really shines in the world of meteorology is its use in nowcasting. To produce a nowcast, current high frequency observations/datasets (such as those from radar and satellites) and short-range forecasts are combined by models to produce a forecast for the conditions of the next 0-6 hours in a very high spatial resolution. This is extremely helpful for those working in disaster prevention and aid, generating far more accurate flood warnings or tornado path projection for example. Nowcasting could also be used by those whose operations are tied to conditions with exact cut-off thresholds, who want to operate as much as possible on very marginal days.
Although AI/ML forecasts are making huge advancements, our changing climate is a limitation. Models need to be trained on historical observations and as our weather becomes more extreme, into conditions not previously seen, AI/ML forecasts may not forecast these extreme conditions accurately, something traditional NWP models may be able to do. This is a great argument for why AI/ML forecasts are a great supplement to standard NWP models, and why both should continue to be developed as we head into the future.
(Jean, et al., 2025)
Conclusion
The field of meteorology is constantly evolving, and new insights, models, processes and datasets are always being studied and developed. With each new progression, more studies and applications appear, and before long a groundbreaking technique becomes the new norm. So much has changed over the last 25 years, it is impossible to say where meteorology will be after the next 25, but wherever the sector is headed, WeatherQuest is eager to be there.
References
Argo Programme. (2026, May 12). Argo Program. Retrieved from NOAA AOML: https://www.aoml.noaa.gov/argo/
ECMWF. (2022, November 24). 30 years of ensemble forecasting at ECMWF. Retrieved from ECMWF Media Centre: https://www.ecmwf.int/en/about/media-centre/focus/2022/30-years-ensemble-forecasting-ecmwf
Jean, M., Pappenberger, F., Chan, P. W., Bouchet, V., Stav, N., & Honda, Y. (2025, October 13). Forecasting the Future: The Role of Artificial Intelligence in Transforming Weather Prediction and Policy. Retrieved from World Meteorological Organization: https://wmo.int/media/magazine-article/forecasting-future-role-of-artificial-intelligence-transforming-weather-prediction-and-policy
Met Office. (2023). National Meteorological Library and Archive. Retrieved from Met Office: https://www.metoffice.gov.uk/binaries/content/assets/metofficegovuk/pdf/research/library-and-archive/library/publications/factsheets/factsheet_15-weather-radar-2020_2023.pdf
Met Office. (2026, May 12). History of numerical weather prediction. Retrieved from Met Office: How weather forecasts are created: https://weather.metoffice.gov.uk/learn-about/how-forecasts-are-made/history-of-numerical-weather-prediction
Met Office. (2026, May 12). The UK land observation network. Retrieved from Met Office: https://weather.metoffice.gov.uk/guides/observations/uk-observations-network
NOAA National Severe Storms Laboratory. (2026, May 12). Research Tools: Dual Polarized Radar. Retrieved from NOAA NSSL: https://www.nssl.noaa.gov/tools/radar/dualpol/
Smith, M., & Ward, A. (2025, December 22). Sentinels in the Sky: 50 Years of GOES Satellite Observations. Retrieved from NASA: https://science.nasa.gov/science-research/earth-science/sentinels-in-the-sky-50-years-of-goes-satellite-observations/
Royal Meteorological Society Professional Accreditation
We are incredibly proud to announce that our meteorologists have been awarded either Registered Meteorologist (RMet) or Chartered Meteorologist (CMet) accreditation from the Royal Meteorological Society!
Over the last few years we have been supporting our meteorologists in their progress to achieve professional accreditation from the Royal Meteorological Society. Achieving professional accreditation demonstrates our staff’s competency and credibility within the field of meteorology, whilst also bolstering their career through continuous professional development.
A big congratulations to those below for their amazing and well-deserved achievement!
We are pleased to announce that all our staff have completed Citation’s Equality, Diversity and Inclusion (EDI) training course, led by the fantastic Natalie Hunter!
It was incredibly engaging and informative, educating our staff on common workplace biases, discrimination, inclusive practices, and legal frameworks such as the Equality Act 2010.
At WeatherQuest, we believe that EDI is incredibly important for a multitude of reasons and is directly integrated into our workplace policies. Providing staff with equal opportunities encourages everyone to have a voice and to engage/collaborate within a safe working environment. Not only does this make staff feel valued, increasing their wellbeing, enthusiasm, and trust, but it also makes the workplace more efficient by removing communication barriers.
WeatherQuest is also extremely fortunate to have strong ties with the University of East Anglia, providing us with access to a diverse pool of ambitious students for summer projects, internships, and potentially even hiring opportunities. This increases innovation within the company by opening the doors to these individuals with specific proficiency, experiences, and ideas, and enabling them to get stuck in working alongside the team on a variety of tasks.
Thank you, Natalie, for your time and expertise! Now that our staff are EDI-trained, we hope WeatherQuest has become an even more approachable and inclusive place of work!
On the 6th of January 2026, a low-pressure system began to develop out in the Atlantic. Starting off at ~1020 hPa, it was named Storm Goretti by Météo-France, as the most severe wind impacts were initially forecast for northern France. The low was pushed above the Azores high block, with its trajectory towards the Channel. By midday on the 7th of January, the low (shown in the blue ring below) deepened to 1017 hPa, and the Met Office issued Yellow and Amber weather warnings for wind, rain, snow and ice for large areas of the UK.
Main event
At midnight (00:00) on the 8th of January, the low deepened to 1006 hPa and was strengthening rapidly, losing 2 hPa every hour, reaching 994 hPa by 06:00. Due to its strength and trajectory, the Met Office upgraded their warnings to include a red warning for the Isles of Scilly and parts of Cornwall, and several amber warnings for western parts of the country and the Midlands.
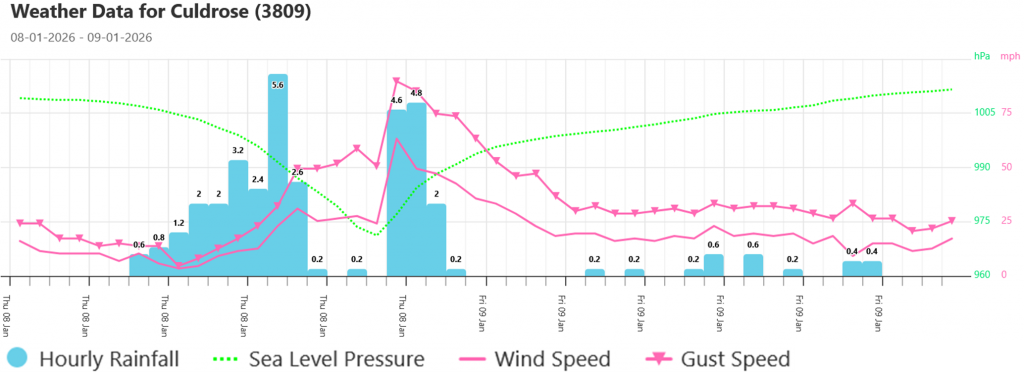
By the evening, the storm travelled directly over Cornwall, with peak winds of 99 mph being recorded at St Mary’s Airport on the Isles of Scilly. The time series from Culdrose weather station, Cornwall, shows how sudden the drop in pressure was, reaching a low of 969 hPa, with the leading rain before and sharp wind gusts just after the centre of the low passed overhead. The highest wind gust recorded at this station was 90 mph.
The damaging high wind speeds can be explained not only by the position of the low, but also by the type; Strom Goretti was a textbook Shapiro-Keyser style cyclone. During a Shapiro-Keyser storm’s development, the cold front detaches from the leading warm front, allowing cool air from behind the cold front to rapidly sink, accelerate and wrap around warm front, potentially creating a sting jet of intense wind speeds. This detachment can be seen in the pressure chart for 18UTC on the 8th of January.
While the Southwest saw the brunt of the strong winds and rough seas along the coast, large amounts of snow fell across parts of northern England, Wales and the Midlands. Values ranged from 8cm at Nottingham, up to unofficial reports of >20cm over high ground. Across the South and the East, the main impact was a prolonged spell of rainfall. See the WQ Radar video below for a snapshot of the event.
Disruption
Winter windstorms can be very dangerous, and Goretti was a severe case. Below are just a few impacts the storm caused:
A man was unfortunately killed when a tree fell on his caravan in Helston.
>200,000 properties without power, 12,000 of which were still without power on Sunday the 11th.
The snow, combined with the mild weather after the storm meant there were many flood warnings and alerts in place all over the country.
Water mains pipes damaged by uprooting trees and freeze-thaw bursts, leaving around 30,000 properties without water.
Flights were cancelled and airports were shut down across the country.
Some cars and vans were overturned on some main roads.
We hope everyone stays safe during the storm season!
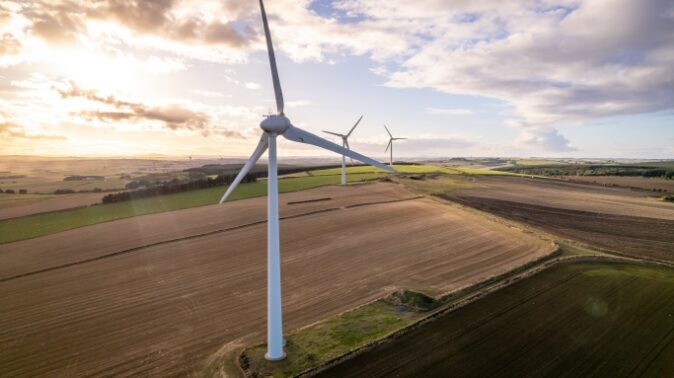
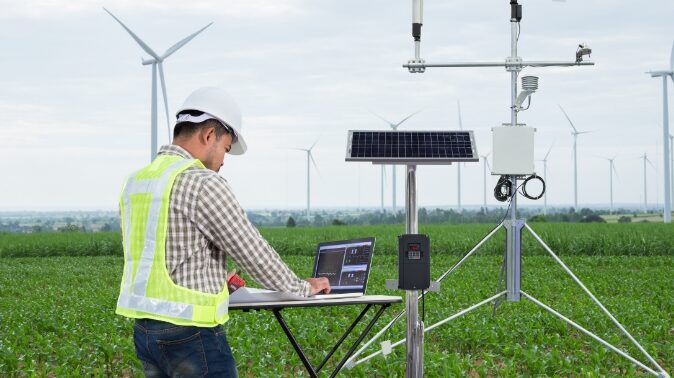
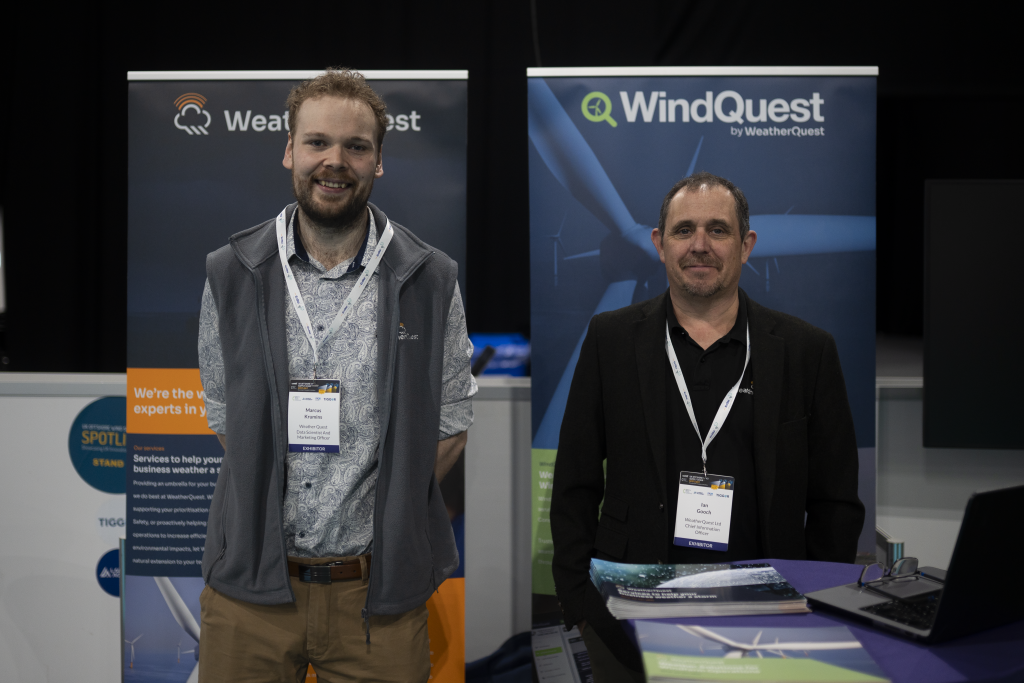
On the 10th of December, Ian, Morrie and Marcus headed up the Highland Hall, Royal Highland Centre, Edinburgh to take part in the UK Offshore Wind Supply Chain Spotlight 2025. Supported by the Fit 4 Offshore Renewables program, WeatherQuest were provided a stand at the event to showcase the Offshore Wind tailored services we provide and create innovative connections with others in the sector.
It was an early start, with the trio having set up the WeatherQuest stand by 08:00 ready for the delegate registration and entry beginning at 08:30 and the main event start at 09:00. Throughout the day, there were many great exciting conversations between delegates and the WeatherQuest team, providing some really exciting opportunities for future partnerships, projects and products.
Have a look below at some action shots taken by Morrie!
The day was a great success for us, and we thank the Offshore Renewable Energy Catapult and Offshore Wind Growth Partnership for providing us the opportunity to showcase what we do for the offshore industry and creating potential future links with others in the sector.
Budburst leads to a period of vulnerability to springtime frost in the vineyard. Budburst timing varies according to grape variety and to year as a function of Growing Degree Days (GDD). When a frost is forecasted during the budburst period and when vineyard temperature measurements show a convincing trend in that direction, vineyard managers need to rapidly assess which frost mitigation measures may most effectively mitigate the potentially devastating impacts. For this, an understanding of frost type is important.
Radiation Frosts generally involve cold air at the ground surface and significantly warmer air above (a situation also known as a Temperature Inversion). Clear skies and light winds overnight help to encourage the development of such an Inversion and, if the starting temperature in the evening is cool enough, the ground may lose enough energy overnight for a Ground Frost to occur. This may be followed by the potential for a frost in the overlying air too (an Air Frost) as the ground cools the adjacent air above. In these conditions, the overnight ground temperature is usually colder than the air temperature at bud height (typically1m above ground) which in turn is usually colder than the temperature recorded by a typical weather station (usually at 1.5m height). Those temperature differences can commonly be several degrees Celsius, sometimes more.
Advection Frosts, meanwhile, such as those which occurred on the 26th and 27th February 2018 (The Beast from the East), don’t exhibit such significant Temperature Inversions, so lack any natural heat source to mitigate the frost impacts. They are typically associated with a deep layer of cold Polar or Arctic Air, sometimes with strong accompanying winds, and often affect large areas when they occur. Advection Frosts are more difficult to defend against due to the sheer volume of cold air involved – a significant surface heat source is required.
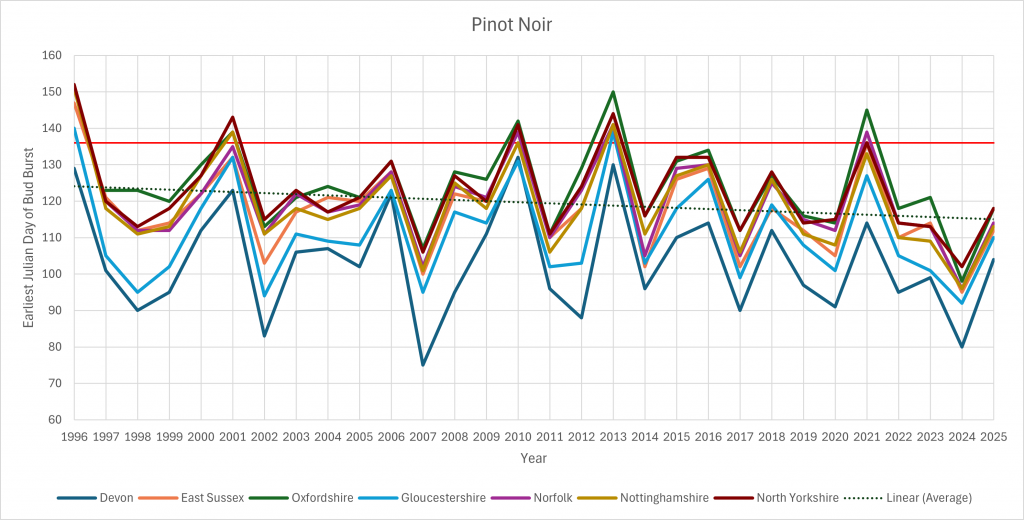
The graph below shows how the start of budburst in Pinot noir has varied in different counties over the last 30 years, based on our budburst model (Day 90 = 31st March, Day 120 = 30th April). Each county here is represented by a specific vineyard, but we can repeat the calculation for your specific location too. The dotted line shows how budburst has been starting progressively earlier, moving forward by 3 days per decade on average. So, although the climate is warming overall, and frost frequency declining, this change in phenology is compensating for this, meaning frost risk remains a significant problem.
As an example, May 15th 2020 (Day 135, the horizontal red line on the graph) saw a very late spring frost event across major vineyard areas. Budburst in Pinot noir that year was estimated to be around Day 105 in East Sussex and Day 115 in Norfolk. But it’s easy to see how much more damaging it could have been if it had happened say in 2016 or 2021, when budburst in these same counties was around Day 130.
Vineyard locations overlayed on the minimum temperatures during May 15th 2020.
So, the first challenge is to be aware when buds are vulnerable, to then have access to site specific vineyard forecasts and finally to be able to distinguish between radiation frosts and advection frosts in order to optimise frost mitigation measures.
This is where our frost forecasting tool, VineBuddy, comes in. VineBuddy provides site-specific bud-height frost forecasts, including Frost Type, helping vineyard managers take timely and well-informed action. Integrated with in-field sensors, VineBuddy takes account of the variations in temperature which naturally occur in the vineyard due to topography, ensuring you’re never caught off guard.
The VineBuddy service process.
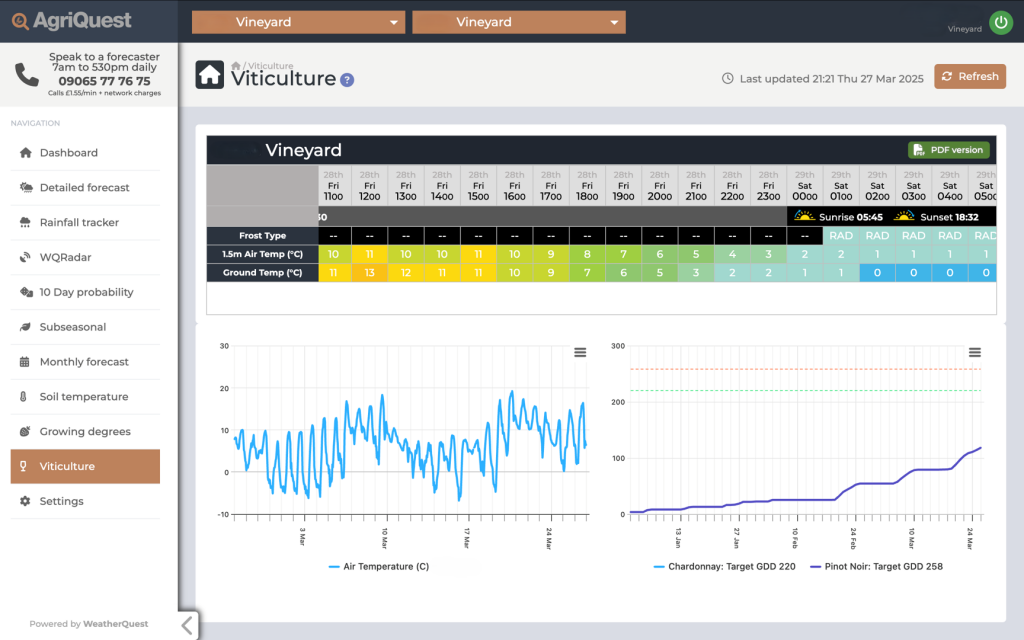
The VineBuddy service consists of an easy-to-use WebApp dashboard, showing the past 30 days of local temperatures, a GDD budburst threshold monitor and 48-hour ahead frost forecasts, with an option to integrate your own within-vineyard weather sensors. The WebApp is complemented by WhatsApp Frost Alerts and the option to call the WeatherQuest Forecast team, when you need to, for peace of mind.
The Viticulture dashboard.
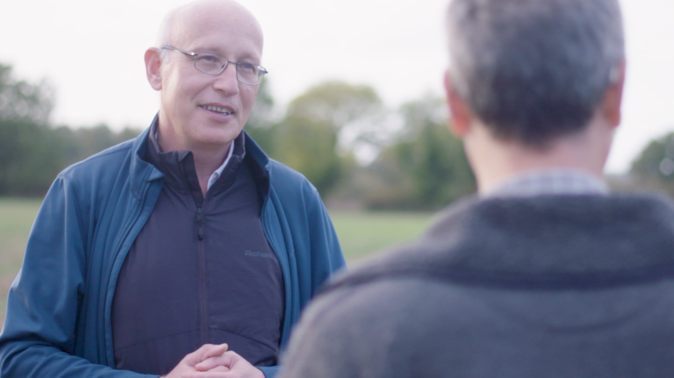
If you would like to find out more, speak to WeatherQuest’s Steve Dorling at the Vineyard Show on 19th November 2025 where Steve is a speaker in the seminar programme. Or visit the Vinescapes stand at the show to express your interest and sign up for a free VineBuddy trial during February 2026. If you can’t make the Vineyard Show, you can also head to the Vinescapes website and complete the VineBuddy form:
WeatherQuest Invests in Mental Health First Aid Training
News / WeatherQuest Invests in Mental Health First Aid Training
WeatherQuest Invests in Mental Health First Aid Training
WeatherQuest is pleased to share that two members of our team, Ian Gooch and Ruby Warner, have recently qualified as Mental Health First Aiders through a two-day course delivered by St John Ambulance.
While Mental Health First Aiders are not therapists or counsellors, the training equips Ian and Ruby with the skills to recognise signs of mental ill-health, listen non-judgmentally, offer initial support and signpost colleagues to professional help where appropriate.
Supporting our people, supporting our clients
At WeatherQuest, we know that good mental health is essential to doing our best work – especially in a field where clear thinking, judgement and collaboration are vital for delivering high-quality weather and climate services.
By investing in Mental Health First Aid training, we are:
Strengthening our internal support network so colleagues have someone trained to talk to if they’re struggling.
Improving how we assess and manage psychosocial risks in the workplace, alongside our existing health and safety commitments.
Exploring tools such as Wellness Action Plans, so that team members can proactively identify what helps them stay well at work and what early warning signs to look out for.
This work draws on best-practice guidance from recognised mental health charities and is part of our broader commitment to creating an inclusive, supportive and sustainable working environment.
A long-term commitment
Mental health problems are common and treatable, and we want everyone at WeatherQuest to feel able to speak up early and seek support. By building awareness and putting practical measures in place, we aim to:
Reduce stigma around mental health
Encourage open, respectful conversations
Help our team stay healthy, resilient and focused – for the benefit of our colleagues, partners and clients
“Our people are at the heart of everything we do,” says Ian. “Investing in mental health training is one way we can look after each other, so we’re at our best when we’re looking after our clients.”
Two WeatherQuest Interns are part of the UEA’s Class of 2025!
As the graduation week here on the UEA campus comes to an end, two of our interns at WeatherQuest are part of the class of 2025!
Anna, who has been supporting the IT team across a range of areas, graduated on Tuesday the 15th of July from her MSc Data Science degree. Although the day started out nice and bright, rain came through after midday, leading to a very wet afternoon and early evening. Luckily, she didn’t get too wet as we managed to snap a picture before all the rain kicked off!
Ollie, who has been spearheading our work with machine learning and AI graduated from his MSci Natural Sciences course on Thursday the 17th of July. The weather seemed to be much kinder to Ollie, as Thursday was a lot less unsettled and had no rain. Again, Ollie had enough time during the hustle and bustle for a photo!
Having been integral to our team over the last year, congratulations to both for graduating, and we hope they are very proud of their achievement!
To find out more about our Research and Development service
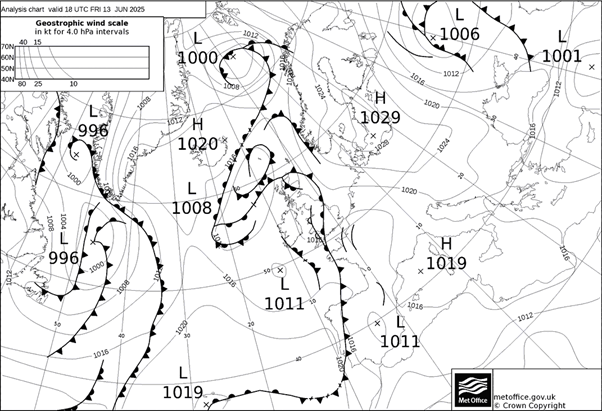
On Friday the 13th of June 2025, the low pressure system located to the West of Ireland set up strong southerly flow of warm and humid air which destabilised over Northwest Europe, releasing substantial amounts of Convective Available Potential Energy (CAPE). The resulting convective system produced frequent lightning and travelled over Nantes and into Normandie, before following the coastline of Northern France. It then travelled north over the Channel, hitting areas of Kent and East Anglia.
The Met Office surface pressure chart for 13/06/2025 at 18:00 UTC.
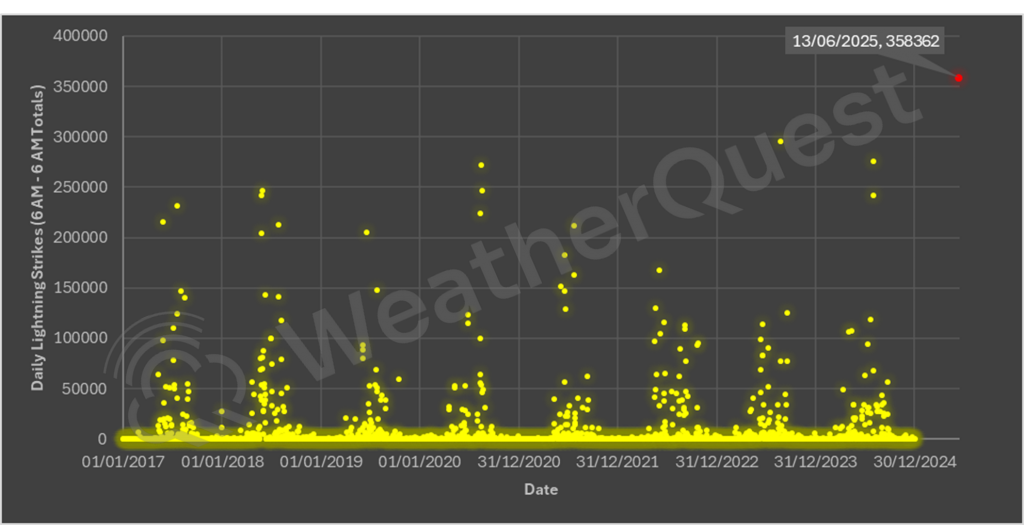
Using lightning data from METEORAGE, in the 24-hour period of 06:00 13/06/2025 to 06:00 14/06/2025, there were 358,362 strikes recorded in WeatherQuest’s custom domain, which covers areas of Northern France and the British Isles. This was the most amount of recorded lightning in the domain since our records began, over 63,000 more than the second most active 24-hours.
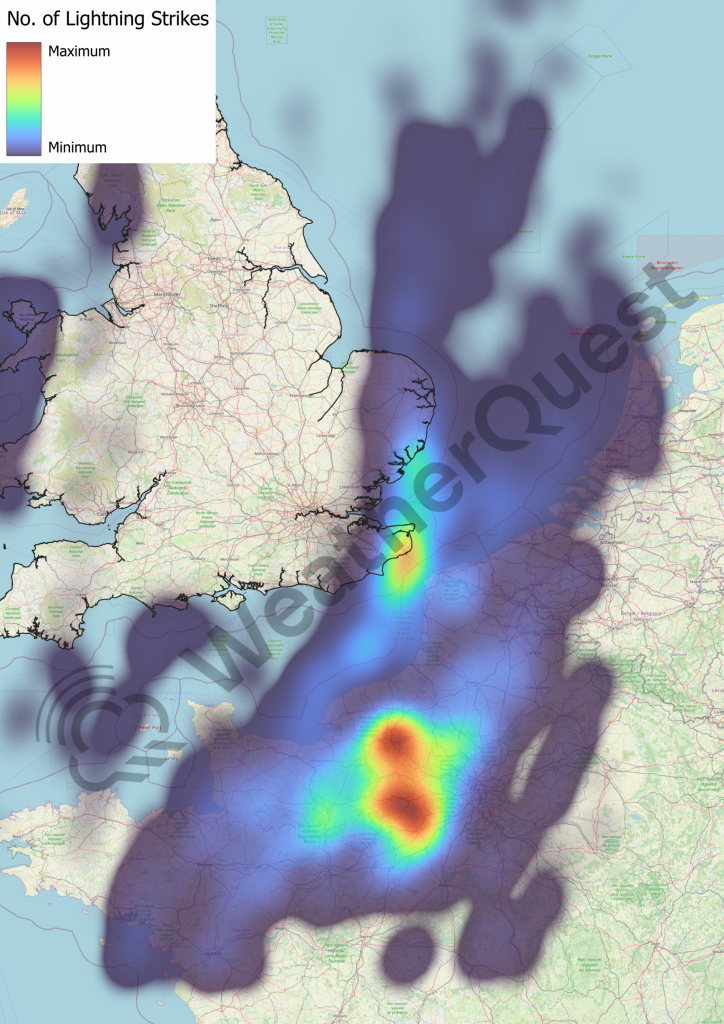
The number of lightning strikes in WeatherQuest’s custom domain each day (06:00 – 06:00 24-hour period) from 01/01/2017 to 13/06/2025.A heat map showing where lightning strikes were concentrated on the night of 13/06/2025 – 14/06/2025.
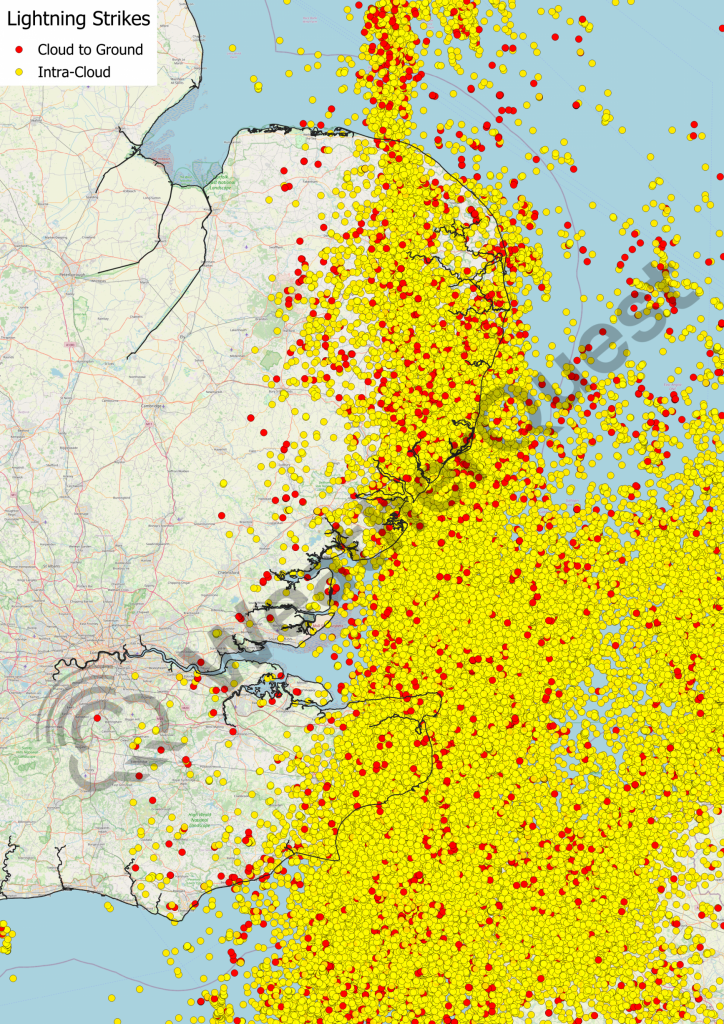
There are two different types of lightning, Intra-Cloud (IC) and Cloud-to-Ground (CG). Intra-cloud means that the lightning did not reach earth but instead struck through the cloud itself. Determining the type of lightning strike is achieved by analysing its electromagnetic signal discharge, with IC and CG both having different signals. The lightning during this 24-hour period was mainly IC (93% of total), but despite this, 25,621 strikes were CG, a quarter of which happened over the French city of Rouen, and its surrounding area (see the heat map above)!
The dispersion of lightning strike type over East Anglia and the Southeast.